Final dates! Join the tutor2u subject teams in London for a day of exam technique and revision at the cinema. Learn more →
Reference Library
Collections
- See what's new
- All Resources
- Student Resources
- Assessment Resources
- Teaching Resources
- CPD Courses
- Livestreams
Study notes, videos, interactive activities and more!
Economics news, insights and enrichment
Currated collections of free resources
Browse resources by topic
- All Economics Resources
Resource Selections
Currated lists of resources
Practice Exam Questions

Current Account Deficit & Policies (Revision Essay Plan)
Last updated 4 May 2019
- Share on Facebook
- Share on Twitter
- Share by Email
Here is a revision essay plan on this question: "Assess policies that might be most effective in reducing the size of the UK current account deficit in the future."
In 2018, the UK current account, saw a deficit of £82 billion, compared with £68 billion in 2017. The current account deficit was 3.9% of GDP in 2018 compared with 3.3% in 2017.
KAA Point 1
One demand-side policy is a rise in direct taxation – e.g. increase in income tax – reduces real disposable income – causing contraction in household spending – reduces demand for imports (expenditure-reducing effects) – assuming that the value of exports remains the same - this will lead to an improvement in net trade which is a component of the current account.
EVAL Point 1
Higher direct taxes are not always effective in reducing spending – people may view tax hikes as temporary – and choose to maintain spending by reducing their savings out of disposable income. Reduced consumer spending could also lead to a fall in planned investment which could then hinder the productive capacity of businesses that export.

KAA Point 2
A second approach might be for the Bank of England to try achieve a competitive depreciation of sterling e.g. by keeping interest rates lower, expanding QE or by direct intervention in currency markets. Weaker £ increases M prices and makes exports more competitive (in $s etc) – leading to expenditure-switching effects and an improvement in net trade providing that the Marshall-Lerner condition is met.
EVAL Point 2
The main causes of current account deficit are likely to be structural (e.g. linked to a persistent productivity gap) rather than due to an over-valued exchange rate. The majority of exports also require imports, so weaker £ increases costs of imported raw materials & components and also makes imported technology more expensive which can then hamper price competitiveness in the future.

FINAL CONCLUSION
Demand side policies carry risks (e.g. cuts in real living standards) and the option of a competitive devaluation is not available if the UK continues to operate a free-floating exchange rate system. Supply-side economic reforms can perhaps be more effective in the long run in helping to correct an external deficit. E.g. cuts in corporation tax designed to attract inward investment from overseas e.g. car manufacturing firms which then increases export volumes. Increased spending on STEM education and tax relief for research & development in emerging sectors such as life sciences can raise a country’s export potential in industries where global demand is likely to be strong in the years ahead.
- Current Account (BoP)
You might also like
Balance of payments (revision presentation).
Teaching PowerPoints
Measuring the Balance of Payments
Study Notes
Balance of Payments - Current Account Deficits
Balance of payments & currencies revision quiz.
Quizzes & Activities
UK Current Account - NOT just the Balance of Trade!
17th March 2015
Financing the UK current account deficit
31st March 2015
Interpreting the Balance of Payments
Topic Videos
Causes of a Current Account Deficit Exam Answer
Our subjects.
- › Criminology
- › Economics
- › Geography
- › Health & Social Care
- › Psychology
- › Sociology
- › Teaching & learning resources
- › Student revision workshops
- › Online student courses
- › CPD for teachers
- › Livestreams
- › Teaching jobs
Boston House, 214 High Street, Boston Spa, West Yorkshire, LS23 6AD Tel: 01937 848885
- › Contact us
- › Terms of use
- › Privacy & cookies
© 2002-2024 Tutor2u Limited. Company Reg no: 04489574. VAT reg no 816865400.
Discuss whether demand side policies will be successful in reducing unemployment?
- Demand side policies include expansionary fiscal and monetary policies.
- For example, the govt could increase Govt spending and lower taxes. G is a component of AD, therefore, this will cause AD to increase, there may also be a multiplier effect causing AD to increase even more than the initial effect
- Lower tax rates will increase consumer’s disposable income and therefore spending will increase.
- Also, the MPC could cut interest rates, this makes borrowing cheaper and encourages spending rather than saving, this will also have the effect of increasing AD
- The above diagram shows an increase in AD causing higher real GDP and a higher price level. Note there will only be an increase in real GDP if there is spare capacity in the economy.
- If real GDP increases then there will be higher demand for workers, as firms need to increase production to meet demand. Therefore, unemployment will fall.

- The Phillips curve shows the trade-off between unemployment and inflation, as demand is increased there is lower unemployment with a trade-off of higher inflation.
- However classical economists disagree with this Keynesian analysis they argue that the LRAS is inelastic therefore an increase in AD will not cause a rise in Real GDP.

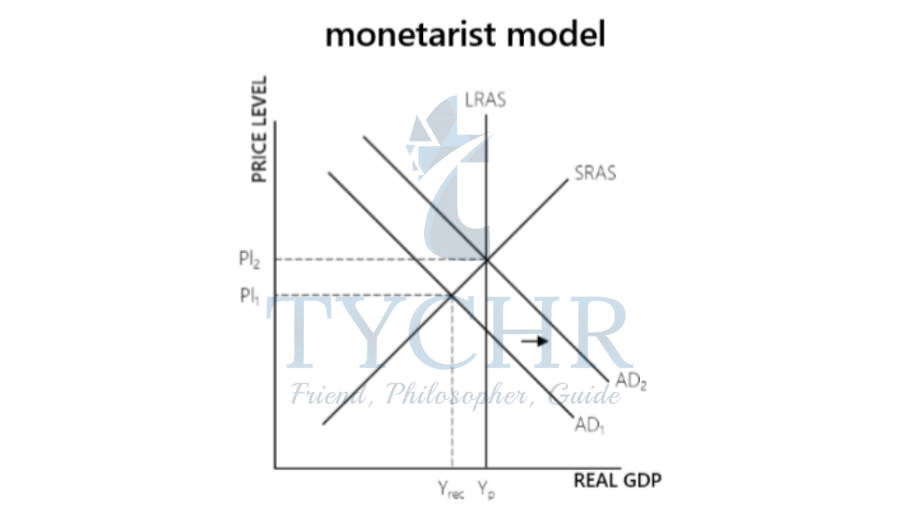
- This diagram shows that an increase in AD will cause an increase in Real GDP in the short run. However, as prices increase firms face an increase in their wage bill so the SRAS shifts to the left. This causes Real GDP to return to its original level of output. Therefore any fall in unemployment will only be temporary according to classical economists.
- Therefore they believe there is no trade-off as the Phillips Curve suggests. This Monetarist view gained credence in the 1970s when there appeared to be a breakdown in the relationship between inflation and unemployment
- It is also possible that demand-side policies fail to increase AD, in the Great Depression (and in Japan in the 1990s) cuts in taxes did not increase AD because consumer confidence was very low. Therefore fiscal policy failed to reduce unemployment.
- Cyclical unemployment is only one cause of unemployment. Over types of unemployment include Real Wage or (classical unemployment) this occurs when trades unions force wages above the equilibrium reducing demand for labour
- The Natural rate of unemployment refers to the supply side factors such as structural and frictional unemployment. this type of unemployment will occur even when the economy is at full output. Therefore these types of unemployment will not be reduced by demand-side factors. Classical economists argue that all unemployment is due to supply-side factors such as occupational immobilities, labour market imperfections and geographical unemployment.

Conclusion to Essay
Demand-side policies can only reduce cyclical unemployment, which occur during a recession. Classical economists argue that this will only last a short time and the markets will clear of their own accord. However, in practice, this often doesn’t occur. Govt intervention can shorten a recession and therefore reduce unemployment. Nevertheless, it will also be important for the govt to tackle different types of unemployment with supply-side policies.
https://www.economicshelp.org/blog/1364/economics/phillips-curve-explained/
https://www.economicshelp.org/blog/571/unemployment/trade-off-between-unemployment-and-inflation/

Page One Economics ®
The science of supply and demand.

"A body in motion tends to stay in motion unless acted on by an out-side force."
—Isaac Newton
Science Is Everywhere
We live in a world governed by the laws of science. From gravity, to electromagnetism, to sound waves, our lives are filled with scientific phenomena that structure and affect every facet of our daily routine. As a species, we have attempted at every turn to channel the laws of science to our own benefit, constantly working to build better products and to develop improved means of manufacturing. However, sometimes science unveils itself in unanticipated ways—ways that often force its will on the distribution of goods in markets.
Figure 1 Personal Consumption Expenditures
SOURCE: FRED ® , Federal Reserve Bank of St Louis; https://fred.stlouisfed.org/graph/?g=r60z , accessed January 2021.
Few events demonstrate this fact better than the COVID-19 pandemic of 2020. As this new viral strain spread around the globe, many businesses in the United States closed or reduced workers' hours, sometimes by the choice of businesses—to prevent employees from catching the virus—and sometimes due to government stay-at-home orders. 1 In the early months of the pandemic, virtually no industry or market remained unaffected as the economy declined: Consumer spending on goods and services dropped by 6.7 percent in March and 12.7 percent in April (Figure 1) and the unemployment rate rose from a 50-year low of 3.5 percent in February to a post-Great Depression record of 14.7 percent in April (Figure 2).
Figure 2 Unemployment Rate
SOURCE: FRED ® , Federal Reserve Bank of St. Louis; https://fred.stlouisfed.org/graph/?g=r5AM , accessed January 2021.
Supply and Demand
COVID-19 affected markets the same way they are affected by any outside force—through supply and demand . In competitive markets , supply and demand govern the ways that buyers and sellers determine how much of a good or service to trade in reaction to price changes.
The law of demand describes the behavior of buyers in markets: As the price (P) of a good or service rises, the quantity demanded (Q D ) of that good or service falls. Likewise, as the price of a good or service falls, the quantity demanded of that good or service rises. Consider your favorite snack food. A downward sloping demand curve indicates that as the price of the snack increases, you would be able and/or willing to buy a smaller amount. This relationship is demonstrated by the downward sloping demand curve in Figure 3. When the price increases from P 1 to P 2 , the quantity demanded decreases from Q 1 to Q 2 .

Similarly, the law of supply describes the behavior of sellers in markets: As the price of a good or service rises, the quantity supplied of that good or service rises. Likewise, as the price of a good or service falls, the quantity supplied of that good or service falls. Therefore, as the price (as determined by the market) of your favorite snack rises, firms are willing to produce more units. This relationship is demonstrated by the graph of the upward sloping supply curve in Figure 4. When the price increases from P 1 to P 2 , firms are willing to supply a greater quantity. That is, the quantity supplied increases from Q 1 to Q 2 .

Market prices are constantly adjusting to bring into balance the amount desired by buyers and the amount sold by sellers. This balance is found at the equilibrium price , where supply and demand intersect (Figure 5). At this point we have our equilibrium price (P e ) and equilibrium quantity (Q e ).
Scientific Events
Biology: COVID-19
The COVID-19 pandemic and the associated lockdowns hit the Leisure and Hospitality sector particularly hard (Figure 6). A recent study looked at hours worked by sector in the immediate aftermath of stay-at-home orders—March 2020. 2 As shown in Figure 6, the effects on hours worked are separated into supply factors (red bars) and demand factors (blue bars) and measured as the percent change in historical growth rates of hours worked in each sector. Supply factors are related to businesses partially or fully shutting down. Demand factors are related to reduced consumer spending, such as from customers not shopping, to avoid catching the virus, or simply cutting back on spending due to income loss. 3 For most sectors, hours worked dropped compared with historical trends due to both supply and demand factors.

When a factor other than price affects supply or demand, it is modeled by shifting the supply or demand curve, respectively, rather than moving along the curve. For increases in supply or demand, the curves are shifted to the right to higher quantities. For decreases, the curves are shifted to the left to lower quantities.

Although supply factors contributed to most of the almost 10 percent drop in the Leisure and Hospitality sector in March 2020 compared with historical growth, demand factors also contributed (see Figure 6). The change in this sector is demonstrated in Figure 7: Demand decreases (shifts to the left) and supply decreases more (also shifts to the left), resulting in a lower quantity of goods sold at the new equilibrium (Q 2 ). 4
Meteorology: Hurricane Sandy
In the fall of 2012, Hurricane Sandy hit New York City and surrounding regions, with millions of citizens and thousands of businesses losing power. In New Jersey, only 40 percent of gas stations tracked by AAA had power and were operational in the immediate aftermath of the hurricane. 5 As a result, consumers faced a severe shock to the supply of gasoline.

Applying the laws of supply and demand, one can predict how this event would change the quantity and price of gasoline at the pump: Assuming unchanged demand, 6 the supply curve would shift to the left (Figure 8). The equilibrium quantity would decrease from Q 1 to Q 2 , with the price increasing from P 1 to P 2 .
Did this occur? Not exactly. New Jersey Governor Chris Christie promised to punish gas stations that significantly increased prices above their pre-hurricane levels (P 1 ). 7 As a result, prices remained low because they were not allowed to reach equilibrium, so oil firms had no incentive to bring extra gasoline to the market at the lower price, long lines of vehicles formed, and many stations sold out due to limited supply.
Chemistry: The Ethanol Fuel Boom
In the late 2000s, ethanol experienced a boom as an alternative fuel. Compared with gasoline, ethanol was believed to be cleaner burning (produce less carbon dioxide) and could be produced from renewable crops such as corn and sugar cane. 8 With subsidies provided by the U.S. government to produce fuel ethanol, production facilities sprouted up across the Midwest and supply increased in this growing industry. 9
With more and more ethanol being blended into gasoline for use in everyday car engines, many believed that yearly production would continue to grow for years to come. Then, consumers began noticing that their gas engines were being damaged by gasoline mixtures with large percentages of ethanol. 10 As it turns out, the chemical nature of ethanol makes it very attractive to water. When water gets into an engine's fuel, it increases the corrosion of metal and degrades the engine. As a result, regulators decided that gasoline for normal car engines could only contain up to 10 percent ethanol by volume. 11,12

Using supply and demand to analyze fuel ethanol markets is a little tricky due to the volume ethanol limit. In Figure 9, the desire of producers to increase the supply of ethanol is indicated by the rightward shift of the supply curve. Producers would expect ethanol buyers to continue increasing their demand as ethanol becomes more and more popular. However, all else being equal, once buyers are running their vehicles with gasoline with 10 percent ethanol, their desire to purchase more would dramatically decrease and the demand curve would become a nearly straight vertical line. 13 That is, the quantity demanded wouldn't increase much beyond this limit even if the price of ethanol were to decrease because people won't use gasoline with more than 10 percent ethanol. Thus, no matter how much producers wish to increase supply, buyers would not buy much more ethanol and increased production of ethanol would drive down prices.

Figure 10 U.S. Fuel Ethanol Consumption and Percent of Motor Gasoline Consumption, 1981-2019 (June 24, 2020)
Figure 10 confirms this analysis of supply and demand. Fuel ethanol consumption increased dramatically during the 2000s and then flattened out when it reached about 10 percent of motor gasoline consumption. 14
Markets provide a means by which individuals and businesses can trade goods and services. Though goods and services come in many shapes and sizes, they are all governed by the laws of supply and demand. Of course, unanticipated scientific events, such as pandemics and hurricanes, can alter the course of markets. Yet, the same laws that make markets function every day will exert their will—the laws of supply and demand.
https://www.sciencemag.org/news/2020/03/modelers-weigh-value-lives-and-lockdown-costs-put-price-covid-19 .
2 Brinca, Pedro; Duarte, Joao B. and Faria-e-Castro, Miguel. "Is the COVID-19 Pandemic a Supply or a Demand Shock?" Federal Reserve Bank of St. Louis Economic Synopses , 2020, No. 31; https://research.stlouisfed.org/publications/economic-synopses/2020/05/20/is-the-covid-19-pandemic-a-supply-or-a-demand-shock .
3 Some sectors such as Wholesale Trade and Information were positively impacted by demand factors. In the case of the Information sector, the increase may have been caused by families increasing their demand for goods and services to work, communicate, and/or enjoy entertainment from home.
4 Figure 7 depicts price increasing, but price could decrease depending on the size of the supply and demand shifts and how responsive supply and demand are to price changes.
5 Smith, Aaron. "Gas Shortage Continues in Areas Hit By Sandy." CNN Business, November 2, 2012; https://money.cnn.com/2012/11/02/news/economy/gas-shortage-sandy/index.html .
6 There could actually have been an increase in demand from individuals using gas powered electric generators during the power outage.
7 Futrelle, David. "Post-Sandy Price Gouging: Economically Sound, Ethically Dubious." Time , November 2, 2012; https://business.time.com/2012/11/02/post-sandy-price-gouging-economically-sound-ethically-dubious/ .
8 U.S. Energy Information Administration. "Biofuels Explained: Ethanol and the Environment." December 7, 2020, update; https://www.eia.gov/energyexplained/biofuels/ethanol-and-the-environment.php .
9 Byrge, Joshua A. and Kliesen, Kevin L. "Ethanol: Economic Gain or Drain?" Federal Reserve Bank of St. Louis Regional Economist , July 1, 2008; https://www.stlouisfed.org/publications/regional-economist/july-2008/ethanol-economic-gain-or-drain .
10 Johnson, M. Alex. "Mechanics See Ethanol Damaging Small Engines." NBC News, August 1, 2008; https://www.nbcnews.com/id/wbna25936782 .
11 Tyner, Wallace E.; Brechbil, Sarah l. and Perkis, David. "Cellulosic Ethanol: Feedstocks, Conversion Technologies, Economics, and Policy Options." Congressional Research Service, October 22, 2010; http://nationalaglawcenter.org/wp-content/uploads/assets/crs/R41460.pdf .
12 Specialty vehicles with anti-corrosive engine parts were sold to accommodate fuel with higher concentrations of ethanol, including E85, a fuel mixture containing 85 percent ethanol. However, such vehicles and fuel types have yet to gain mass popularity.
13 The demand curve would likely not be fully vertical, as decreases in any fuel component's price, like ethanol's, would increase the quantity demanded of fuel. However, because ethanol makes up a small percentage of fuel, the demand curve is assumed to be nearly vertical.
14 U.S. Energy Information Administration (2020). See footnote 8.
© 2021, Federal Reserve Bank of St. Louis. The views expressed are those of the author(s) and do not necessarily reflect official positions of the Federal Reserve Bank of St. Louis or the Federal Reserve System.
Biology: The study of living organisms.
Chemistry: The branch of science that deals with the identification of the substances of which matter is composed.
Competitive markets: Markets in which there are generally many buyers and many sellers so that each has a negligible impact on market prices.
Demand: The quantity of a good or service that buyers are willing and able to buy at all possible prices during a certain time period.
Equilibrium price: The price at which quantity supplied and quantity demanded are equal. The point at which the supply and demand curves intersect.
Meteorology: The branch of science concerned with the processes and phenomena of the atmosphere, especially as a means of forecasting the weather.
Subsidies: Payments made by the government to support businesses or markets. No goods or services are provided in return for the payments.
Supply: The quantity of a good or service that producers are willing and able to sell at all possible prices during a certain time period.
Cite this article
Subscribe to Our Newsletter
Stay current with brief essays, scholarly articles, data news, and other information about the economy from the Research Division of the St. Louis Fed.
SUBSCRIBE TO THE RESEARCH DIVISION NEWSLETTER
Research division.
- Legal and Privacy
One Federal Reserve Bank Plaza St. Louis, MO 63102
Information for Visitors
- Search Search Please fill out this field.
What Is Demand-Side Economics?
- Types of Policies
- Demand-Side Economics FAQs
- Macroeconomics
Demand-Side Economics Definition, Examples of Policies
:max_bytes(150000):strip_icc():format(webp)/0__mary_hall-5bfc262446e0fb005118b2a7.jpeg "demand and supply side policies essay")
Keynesian economists believe that the primary factor driving economic activity and short-term fluctuations is the demand for goods and services. The theory is sometimes called demand-side economics.
This perspective is at odds with classical economic theory, or supply-side economics , which states that the production of goods or services, or supply, is of primary importance in economic growth.
Key Takeaways
- Demand-side economics refer to the theory that the demand for goods and services drives economic activity.
- A core characteristic of demand-side economics is aggregate demand.
- Governments can generate demand for goods and services if people and businesses are unable to spend.
- Economist John Maynard Keynes developed his economic theories during the Great Depression of the 1930s.
- Keynes believed that a government should increase spending to spur subsequent spending by consumers and businesses in times of depressed economic activity.
Understanding Demand-Side Economics
Keynes maintained that unemployment is the result of inadequate demand for goods. During the Great Depression , factories sat idle. Due to a lack of demand for products, factories had insufficient need for workers.
This lack of aggregate demand contributed to unemployment and, contrary to classical theories of economics, the economy was not able to self-correct and restore balance.
One of the core characteristics of Keynesian economics or demand-side economics is the emphasis on aggregate demand. Aggregate demand is composed of four elements: consumption of goods and services; investment by industry in capital goods ; government spending on public goods and services; and net exports.
Under the demand-side model, Keynes advocated for government intervention to help overcome low aggregate demand in the short-term, such as during a recession or depression. This could reduce unemployment and stimulate economic growth.
John Maynard Keynes
Economist John Maynard Keynes developed his economic theories in part as a response to the Great Depression of the 1930s. Before the Great Depression, classical economics was the dominant theory. It held that through the market forces of supply and demand, economic equilibrium would be restored naturally over time.
However, Keynes believed that the Great Depression and its long-running, widespread unemployment defied classical economic theories. His theories tried to explain why the mechanisms of the free market were not restoring balance to the economy.
Keynes' book, The General Theory of Employment, Interest, and Money , was written in 1936 and reflected his experience as a witness to the Great Depression. In it, he rejects the aforementioned belief that an economy in a downturn would right itself. Instead, he believed that action by the government was called for. It should intervene with increased spending and lower taxes to stimulate consumption.
Types of Demand-Side Economic Policies
Government spending.
If the other components of aggregate demand are static, government spending can help. If people are less able or willing to consume, and businesses are less willing to hire workers and invest in building more factories, the government can step in. It can increase government spending to generate demand for goods and services.
Keynesian economics supports heavy government spending during a national recession to encourage economic activity. Putting more money in the pockets of the middle and lower classes has a greater benefit to the economy than saving or stockpiling the money in a wealthy person's account.
Increasing the Money Supply
Central banks can also achieve this goal by altering interest rates or selling or buying government-issued bonds. This type of intervention is part of what is known as monetary policy. These actions, such as changing interest rates , can be used to increase the total money supply in the economy or the velocity of money flowing through the economy.
Increasing the flow of money correspondingly increases the velocity of money, or the frequency at which $1 is used to buy domestically-produced goods and services. Increased velocity of money means more people are consuming goods and services and, thus, contributing to an increase in aggregate demand.
Example of Demand-Side Economic Policies
The financial crisis of 2008 sparked the use of demand-side economic policy by the U.S. government. The Obama administration lowered interest rates. It also cut taxes for the middle class. It put together a $787 billion stimulus package. What's more, the government intervened to overhaul the financial industry in a way not seen since the days of Franklin D. Roosevelt in the 1930s.
Demand-side economics is another name for Keynesian economic theory. It states that the demand for goods and services is the force behind healthy economic activity.
How Are Supply-Side and Demand-Side Economics Different?
Demand-side economics holds that demand for goods and services drives economic growth. Supply-side economics (also known as classical economic theory ) states that the production of goods and services is the main force driving economic growth. Demand refers to spending on goods. Supply refers to the production of goods.
Who Was John Maynard Keynes?
John Maynard Keynes was an English economist who became known for his macroeconomic theory of demand-side economics in the 1930s. It became known as Keynesian economics. He pushed for the policies of increased government spending and decreased taxes that he believed would stimulate demand for products and services during the Great Depression.
Congressional Research Service. " American Recovery and Reinvestment Act of 2009 (P.L. 111-5): Summary and Legislative History ," Pages 1, 6, 12-13.
Congress.gov. " H.R.4173 - Dodd-Frank Wall Street Reform and Consumer Protection Act ."
- Economics Defined with Types, Indicators, and Systems 1 of 33
- Economy: What It Is, Types of Economies, Economic Indicators 2 of 33
- A Brief History of Economics 3 of 33
- Is Economics a Science? 4 of 33
- Finance vs. Economics: What's the Difference? 5 of 33
- Macroeconomics Definition, History, and Schools of Thought 6 of 33
- Microeconomics Definition, Uses, and Concepts 7 of 33
- 4 Economic Concepts Consumers Need To Know 8 of 33
- Law of Supply and Demand in Economics: How It Works 9 of 33
- Demand-Side Economics Definition, Examples of Policies 10 of 33
- Supply-Side Theory: Definition and Comparison to Demand-Side 11 of 33
- What Is a Market Economy and How Does It Work? 12 of 33
- Command Economy: Definition, How It Works, and Characteristics 13 of 33
- Economic Value: Definition, Examples, Ways To Estimate 14 of 33
- Keynesian Economics Theory: Definition and How It's Used 15 of 33
- What Is Social Economics, and How Does It Impact Society? 16 of 33
- Economic Indicator: Definition and How to Interpret 17 of 33
- Top 10 U.S. Economic Indicators 18 of 33
- Gross Domestic Product (GDP) Formula and How to Use It 19 of 33
- What Is GDP and Why Is It So Important to Economists and Investors? 20 of 33
- Consumer Spending: Definition, Measurement, and Importance 21 of 33
- Retail Sales: Definition, Measurement, and Use As an Economic Indicator 22 of 33
- Job Market: Definition, Measurement, Example 23 of 33
- The Top 25 Economies in the World 24 of 33
- What Are Some Examples of Free Market Economies? 25 of 33
- Is the United States a Market Economy or a Mixed Economy? 26 of 33
- Primary Drivers of the Chinese Economy 27 of 33
- Japan Inc.: What It is, How It Works, History 28 of 33
- The Fundamentals of How India Makes Its Money 29 of 33
- European Union (EU): What It Is, Countries, History, Purpose 30 of 33
- The German Economic Miracle Post WWII 31 of 33
- The Economy of the United Kingdom 32 of 33
- How the North Korean Economy Works 33 of 33
:max_bytes(150000):strip_icc():format(webp)/Term-Definitions_keynesianeconomics1-74a7c574f11345c1b4a2cff2db8065dd.jpg "demand and supply side policies essay")
- Terms of Service
- Editorial Policy
- Privacy Policy
- Your Privacy Choices
Demand-Side And Supply-Side Policies Notes
Demand-side and supply-side policies, introduction to demand-side policies, goals of demand-side principles.
- In order to achieve price stability, full employment, and economic expansion, demand-side policies concentrate on modifying AD (shifting the AD curve). It is based on the idea that actions that affect AD and create gaps between inflation and recession cause short-term fluctuations in real GDP.
- Request side strategies attempt to carry Promotion to expected Gross domestic product and can likewise add to potential Gross domestic product increments.
- Because the policy is at the government’s discretion, government intervention in the economy to influence AD is referred to as discretionary policy. Two kinds: monetary policy and fiscal policy) Automatic stabilizers, which reduce the size of economic fluctuations, have an impact on AD; These are not optional.
- Stabilization policies are approaches to fiscal and monetary policy that aim to lessen short-term fluctuations.
Fiscal policy
The government budget.
- Sales of goods and services
- Sales of government-owned property (privatization)
- includes spending by the government on consumables and everyday recurring items. Wages, salaries for government employees, school supplies, and so on are examples.
- includes public investments and physical capital production
- GDP measurement does not include transfer payments.
- Example: Unemployment benefits, children allowances, etc.
- Balanced budget – tax revenues = government expenditures
- Budget deficit – tax revenues < government expenditures
- Budget surplus – tax revenues > government expenditures
- When there is a deficit, the government borrows money to cover overspending.
- The term “public debt” or “government debt” refers to the deficit accumulation by the government.
- Take note that because they are one-time sources of revenue, revenues from the sale of g/s and government-owned enterprises are not included in the budget; The government cannot continue to sell businesses to pay off its debt.
- A debt that has accrued over a period of deficits can be paid off with proceeds from the sale of state-owned businesses. Due to the lower interest rates on previous loans, those funds can be used for other expenses.
ROLE OF FISCAL POLICY
A discretionary policy known as fiscal policy refers to changes made by the government to taxes and expenditures in order to influence AD. Fiscal policy has the ability to influence the level of government spending, consumption spending (which is funded by taxes), and investment spending, which are the four components of AD (C, I, G, and X-M).
EXPANSIONARY FISCAL POLICY
Fiscal policy that aims to close a recessionary gap by increasing aggregate demand is called expansionary fiscal policy.
- Expansionary fiscal policy can comprise: increasing government spending, lowering individual and corporate income taxes, or a combination of the two.
- AD rises directly as government spending increases.
- Consumption will rise in tandem with an increase in AD as a result of tax reductions.
- Reduced business taxes boost profits, which in turn boost investment spending and AD.
- A surplus will turn into a deficit if the government increases spending and reduces taxes.
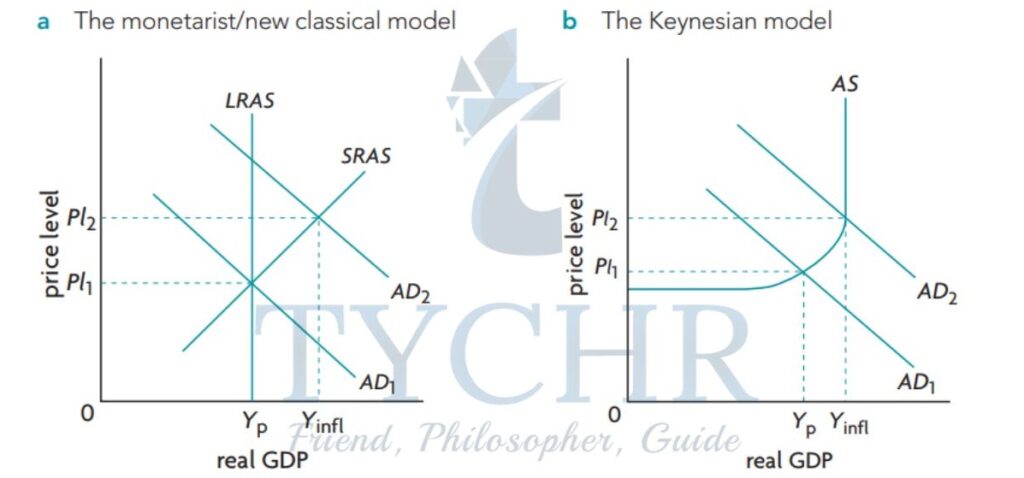
- While both Keynesian and monetarist models indicate that an increase in AD will result in an increase in real GDP, the magnitude of this increase will differ. Due to an increase in price level and an upwardly sloping SRAS curve, the monetarist model’s GDP increase will typically be smaller.
CONTRACTIONARY FISCAL POLICY
- reducing spending by the government, raising personal income taxes, raising business income taxes, or a combination of the two
- Government spending decreases directly decreases AD.
- Increases in tax will decrease consumption and decrease AD.
- It’s possible that the government will turn a deficit into a surplus by cutting spending and raising taxes. Depending on the model, the AD decrease may have different effects.
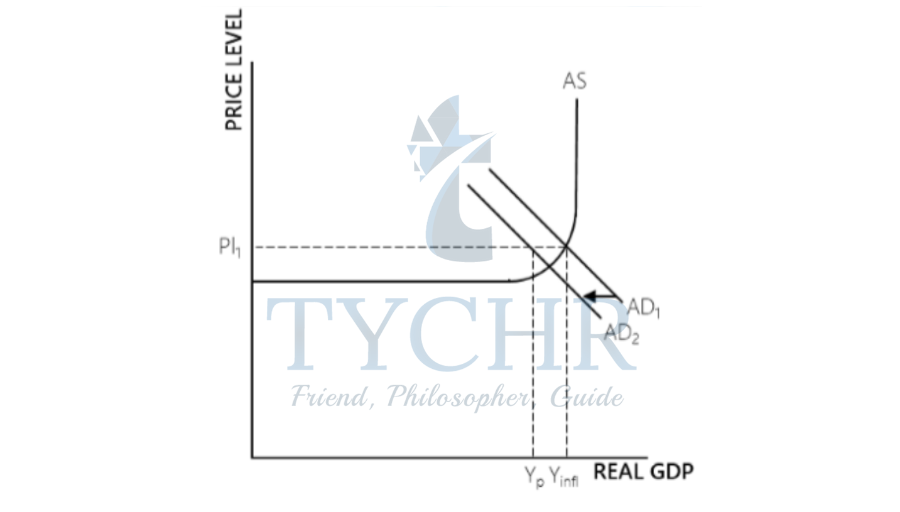
- In the Keynesian model, if AD falls in the part of the AS curve that slopes downward, the effects on real GDP and price level are the same.
- The price level fall will be smaller, but the real GDP decrease will be greater, if AD falls into the horizontal part of the curve.
- In the Keynesian model, the price level can increase with AD, but doesn’t fall easily with AD.
- Ratchet effect – price level moves up when there’s an increase in AD and remains at that level until a further increase in AD.
MULTIPLIER AND FISCAL POLICY
Automatic stabilizers.
- Factors that automatically work to stabilize the economy by reducing business cycle fluctuations are known as automatic stabilizers. There are two significant varieties: income taxes and unemployment benefits that are progressive.
- Income tax increases: As real GDP and income rise, tax revenues rise, reducing disposable income, which hinders growth. As disposable income rises during a recession, the severity of the recession decreases. The stabilizing effect is greater when an income tax system is more progressive.
- Benefits for the unemployed: Benefits rise and are made available to more workers as unemployment rises and real GDP decreases. AD will decrease as a result of these workers spending less without benefits. Benefits decrease during expansion, resulting in slower consumption growth.
- The economy cannot be stabilized and gaps eliminated solely by automatic stabilizers. They can only make fluctuations less severe.
IMPACT ON POTENTIAL OUTPUT
- While short-term stabilization is the primary goal of fiscal policy, it can have an impact on potential GDP growth in the long run.
- Side effects: Stabilization of the economy has the potential to create a macroeconomic environment that fosters growth-influencing activities. If the economy is stable, businesses can plan more effectively.
- Effects directly: Fiscal policies can decide how much money the government spends on various types of capital.
EVALUATION: FISCAL POLICY
- Pulling economy out of deep recession
- The rapid price level increases can be controlled with contractionary fiscal policy.
- can alter the priorities for government spending, including infrastructure, health care, education, and other areas.
- Government spending changes directly impact AD (taxes, not so much).
- Ability to affect potential output
- Affects output indirectly and directly (see above).
- Time lag (number of delays in timing) There is a lag until the problem (gap) is recognized. There is a lag until the appropriate policy is decided upon. There is a lag until the policy takes effect. By the time the policy takes effect, the problem may have changed.
- Political constraints If a contractionary policy is required, some spending cannot be reduced, such as on merit-based goods. Unfavorable policies may be implemented because tax reductions are popular and tax increases are not.
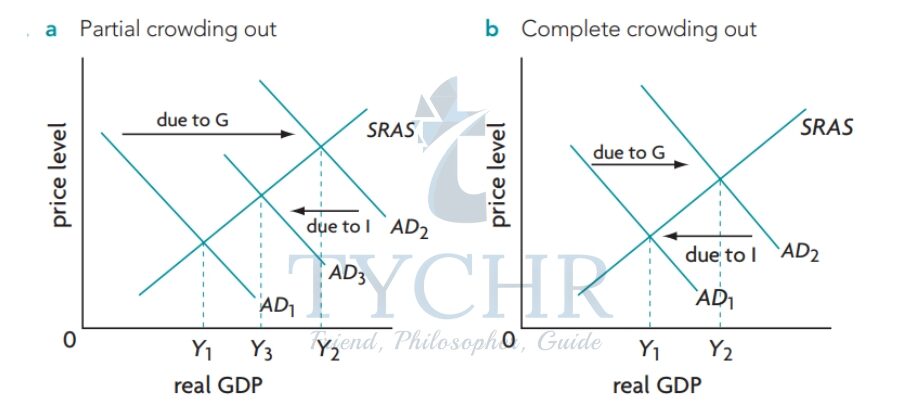
- Partial crowding out: where the investment spending decrease is less than government spending increases
- Complete crowding out: where the fall in I is equal to the increase in G.
- Controversial and some Keynesians believe that the government spending can improve expectations and raise output during a recession.
- Fiscal policy cannot deal with stagflation, as inflation needs a Contractionary policy but the recession requires an expansionary policy
- In a recession, part of the increase in after-tax income is saved. Government spending increases can be more powerful.
- Fiscal policy can’t reach a precise target with respect to output level, employment, and price level. Many factors affect AD simultaneously so the government can’t control it all.
Monetary policy
Central banks and interest rates.
- Each nation’s central bank is in charge of monetary policy.
- Financial institutions that hold deposits, make loans, transfer funds via check, and purchase government bonds are known as commercial banks.
- The government’s financial institution with a variety of responsibilities is the central bank.
- Every country has a central bank. In the Eurozone countries, the responsibility of monetary policy is given to the European Central Bank.
- In some countries, the central bank works independently without any government interference.
- Monetary policy impacts AD indirectly through the rate of interest.
- Borrowing money: payment for the loan (interest) and a principal. Different rates of interest depending on: risk of loan, period of time over which loan must be paid (maturity), size of the loan, degree of monopoly power, etc.
The duties of the central bank include:
- Banker to the government: the bank manages the government’s borrowing, writes checks, receives payments, and holds the government’s cash.
- Banker to commercial banks: The bank can hold deposits on behalf of commercial banks and serves as a banker to them.
- Commercial banks are regulated by the central bank, which makes sure that commercial banks follow the rules.
- Conduct monetary policy: The central bank is in charge of monetary policy in response to changes in interest rates or the money supply.
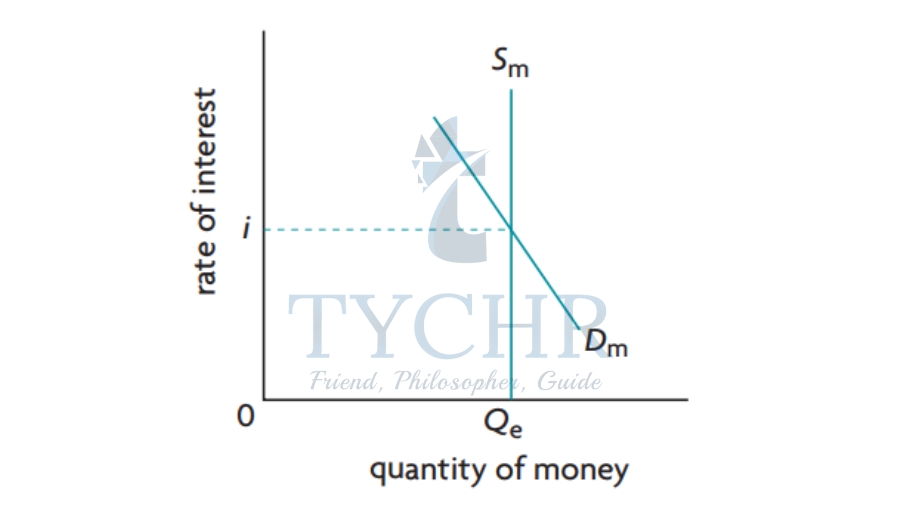
- Anything that can be used to pay for goods and services, including accounts for checking and currency. Market of money: The quantity of money is shown on the horizontal axis, and the interest rate is shown on the vertical axis.
- The “price” of money is the interest rate. The level of the money supply, which is fixed, is set by the central bank.
- Typically, it is a straight line.
- The equilibrium interest rate (i) is the point where demand and supply meet.
- The rate of interest falls when there is more money available, and vice versa.
- The money supply or the interest rate can be controlled by the central bank. They usually focus on the interest rate because the money supply is harder to control.
- A central bank will reduce the amount of money available if they want to raise the interest rate. Because of this, the market can set interest rates.
- The desired interest rate varies by nation: Base rate for the UK, federal funds rate for the US, and minimum refinancing rate for the Eurozone
- Base Rate: Rate at which Bank of England lends to commercial banks Federal Funds Rate: Rate used by commercial banks to borrow and lend (both to and fro) over a 24 hour period.
- Minimum Refinancing Rate: Interest paid by commercial banks when they borrow from the central bank to refinance their accounts.
- Central banks influence the supply of money.
- Open market operations when commercial banks receive deposits from customers they do not keep all their money within their vaults. The funds they must legally keep are called required reserves, determined by required reserve ratio and the excess money over this reserve can be lent out by banks.
- Excess reserves means more loans means more money creation.
ROLE OF MONETARY POLICY
- The ultimate objective is to alter AD through interest rate changes. The following aspects of AD are affected: C is consumption, and I is investment.
- AD will decrease as borrowing decreases and spending decreases if interest rates rise.
TYPES OF MONETARY POLICY
The policy of increasing the money supply in order to expand AD is known as easy (expansionary) monetary policy. AD will rise as a result of consumers and businesses being more likely to consume and invest as a result of an increase in the money supply.
The policy that reduces the money supply to lower AD is referred to as tight (contractionary) monetary policy. Interest rates rise as a result of a decrease in the money supply, which reduces AD because consumers and businesses consume less and invest less.
COMPARISONS
Monetary policy is carried out by the central bank, which aims at changing interest rates to influence the T and C components of aggregate demand. In a recessionary gap, the central bank may pursue an expansionary (easy monetary) policy through lower Interest rates to encourage T and C spending, the objective being to shift the AD curve to the right leading to equilibrium at the full employment level of real GDP (potential GDP). In an inflationary gap, the central bank can pursue a contractionary (tight monetary) policy through higher interest rates aimed at discouraging T and C spending, causing the AD curve to shift to the eft leading to equilibrium at the full employment level of real GDP (potential GDP).
INFLATION TARGETING
- Recently, a number of central banks have tried monetary policy that keeps a certain rate of inflation the same.
- The target is typically between 1.5 and 2.5 percent, with a tolerance margin of one percentage point.
- The inflation target is calculated in terms of the Consumer Price Index (CPI), but it is typically determined by forecasts of future inflation.
- Lower and more stable rate of inflation
- Improved ability to anticipate future rate of inflation
- Inflation targets allow governments to plan fiscal policy to work with monetary policy
- Central bank becomes more open to the public
- If bank focuses only on inflation, it can’t pursue other goals like real GDP stability or full employment levels
- If a supply-side shock leads to stagflation, the central bank may need expansionary monetary policy, but it could cause inflation
- Reduced ability to deal with unexpected events
- Finding an appropriate inflation target Too low: unemployment, too high: problems regarding unemployment
- Difficulties of implementation Forecasts can be unreliable
EVALUATION: MONETARY POLICY
- Implementation is relatively quick and does not go through the political process The independence of the central bank from the government lets them make decisions that are unpopular politically
- There are no political constraint
- There is no crowding out
- You can incrementally adjust interest rates
- Time lags There is still a lag until the problem is recognized and a lag until the policy takes effect
- Possible ineffectiveness in recession During a recession, banks may not want to increase their lending because borrowers might not be able to pay back.
- Conflict between government objectives
- Inability to deal with stagflation
Supply-side policies
Supply-side objectives.
- Supply-side policies focus on the economy’s supply and production sides, particularly on reversing the LRAS or Keynesian AS curve.
- These policies increase the quantity and quality of production factors rather than focusing on reducing the severity of the business cycle.
- Keynesian economists support interventionist policies, which rely on the intervention of the government.
- Policies based on the market emphasize the significance of competitive markets.
INTERVENTIONIST SUPPLY-SIDE POLICIES
- These policies assume that the government must intervene because the free market cannot produce more potential output.
- Training and education as investments in human capital: better training and education can raise productivity by enhancing the quality of labor resources. Positive externalities of education justify intervention. Some measures are: training, assisting youth with grants, and other such activities.
- Healthier workers are more productive and can contribute to an increase in the economy’s potential output if health care services and access are improved. Additionally, health care has positive externalities. Investing in human capital raises AD in the short term and potential output in the long term.
- Capital goods that are new or improved as a result of investments in research and development for new technologies can increase output.
- It has good effects on other people. Patent protection or tax breaks can be provided by governments.
- investment in infrastructure A well-designed infrastructure can cut down on time and effort. Transport costs and travel times can be reduced by having good roads.
- Government policies that encourage the expansion of the industrial sector are known as industrial policies. Investing in human capital, technology, and infrastructure are examples of these policies.
- Assistance for SMBs (Small and Medium-Sized Enterprises): Small and medium-sized businesses may be eligible for low-interest loans, grants, and tax breaks from the government. This is beneficial to the private sector.
- Assistance for emerging industries: In developing nations, infant industries are industries that are just beginning to develop.
MARKET-BASED SUPPLY-SIDE POLICIES
- Real GDP, in this view, tends to be in equilibrium over the long term, so the government doesn’t have to worry as much about stabilization as it does about creating conditions that allow market forces to work well.
- Encouraging competition
- Labor market reforms
- Incentive-related policies
- Competition promotion: Companies are forced to cut costs as a result of competition, which improves efficiency, resource allocation, and possibly quality. As a result, resources that could be used more effectively are utilized.
- A company’s ownership is transferred from the public to the private sector through privatization. Because of improved management, this may result in increased efficiency. Because of high costs, inefficient employees, and other processes, government businesses frequently fail.
- Deregulation is the reduction or elimination of government oversight of private sector endeavors. Regulated by the government, growth is slowed and efficiency is increased.
- Economic regulation is the government’s control of outputs and prices to protect them from competition. Companies can enter monopolistic industries as a result of deregulation to force competition.
- Consumer protection from undesirable effects (some with negative externalities) is the goal of social regulation. Public safety is actually bolstering this, but some argue that it is inefficient and expensive.
- Private financing of public sector projects: companies in the private sector will compete with one another to take on projects for the public sector.
- outsourcing or contracting out – public services are provided by private companies under contract.
- Trade liberalization: Trade barriers have been reduced, allowing for more open international trade.
- This has led to a reduction in the power of monopolies and an increase in competition.
- Reforms to the workforce: increasing the flexibility of the labor market and reducing its rigidities, which results in labor markets becoming more competitive, wages responding to supply and demand, and lower labor costs.
- Eliminating minimum wage laws can help reduce unemployment by lowering the equilibrium wage. Flexibility can lead to more investment and expansion.
- Reducing job security – This makes it easier and cheaper for businesses to lay off workers, which can increase profits. Weakening the power of labor and trade unions – Unionized labor groups typically succeed in obtaining wage increases.
- Reducing unemployment benefits – Unemployment benefits can reduce the incentive for looking for a new job.
- Policies related to incentives: This involves lowering a variety of taxes, including personal income taxes. In addition to lowering taxes as part of fiscal policy, tax cuts can raise after-tax incomes, which encourages people to work more and makes more people looking for work; these may cause the LRAS curve to move outward.
- lowering taxes on interest income and capital gains—the capital gains tax is a tax on financial investment profits. People will be more motivated to save if this is cut down, which will make more money available for investment.
- lowering business taxes: lowering business taxes not only raises AD, but it also raises profits after taxes that can be invested.
EVALUATION: SUPPLY-SIDE POLICIES
- Time lags These policies work after time lags because all policies need time to work.
- The market is unlikely to provide investment, R&D, training, education, and other types of support. The government can target industries for growth with interventionist policies.
- Inefficiency and misallocation may result from government intervention.
- Political pressure may make government intervention less effective and ultimately lead to government failure.
- Spending is required for government intervention, which comes with opportunity costs.
- There are effects on both the supply and demand sides of ax cuts. However, people may work fewer hours and have more free time as their disposable income rises.
- By lowering the natural rate of unemployment, supply-side policies can create employment. Increased training and skills can help with structural unemployment, and information that reduces frictional or seasonal unemployment is provided by interventionist policies, which reduce unemployment.
- By making the labor market more responsive to supply and demand, market-based policies have the potential to reduce unemployment. Unemployment can rise as a result of market-based policies that encourage competition. Employees may be let go by privatized businesses in an effort to cut costs and improve efficiency. However, these may only be a temporary increase until the benefits become more substantial.
- Supply-side policies can shift the LRAS curve to the right, so it can reduce inflationary pressure when an AD increase is matched by a LRAS increase.
- Interventionist: based on government spending
- Incentive-related: tax cuts
- Interventionist with mixed effects (human capital): more favorable, particularly if dispersed, as a result of increased productivity. Inequality can be reduced by interventionist policies that naturally reduce unemployment.
- Market-based: generally negative due to the possibility of unemployment caused by competition. Incentive-related: could make the income distribution worse Privatization: Prices can be pushed up by private businesses with more market power, which hurts the poor.
Environment effects
- Because private companies’ methods may have negative externalities, market-based policies that increase competition may harm the environment. can be restricted by the government.
Evaluating government strategies to combat inflation and unemployment
Unemployment policies – cyclical unemployment.
- cyclical unemployment brought on by falling or low AD. The unemployment rate can be reduced and the recessionary gap narrowed by expansionary policies.
- Time lags, political constraints, crowding, ineffective tax cuts as spending, and the inability to fine-tune all contribute to the recession’s severity. If automatic stabilizers were present, the recession would not have been as severe.
- monetary policy that is expansive and quickly implemented; incremental change without restrictions; independence, absence of crowding, delays, ineffectiveness during a severe recession, and conflict between government goals
UNEMPLOYMENT POLICIES – NATURAL UNEMPLOYMENT
- The most serious form of natural unemployment is structural unemployment. Typically, supply-side policies can address this.
- Fiscal and monetary policy can be ineffective.
- Consider the economy at its potential output level, with unemployment equal to the natural rate. The natural rate will temporarily fall as a result of an increase in AD, but inflation will occur. The natural rate will return to its original level as a result of the reduction in AD to combat inflation.
- However, there are some supply-side effects of fiscal policy.
- Interventionist supply-side policies Retraining programs Grants and low-interest loans for retraining Direct government hiring and training Subsidies to companies hiring structurally unemployed workers Subsidies/grants for relocation Methods to reduce frictional unemployment attempt to improve information flow so that job seekers spend less time looking for work.
- The spread of more information to workers about other jobs that are available outside of peak times is one way to cut seasonal unemployment. This has a positive effect on job creation but a negative effect on the government budget.
- Supply-side policies based on the market increase the flexibility of the labor market, which can lower unemployment. A lower minimum wage can also lower unemployment. Weaker labor unions reduce the pressure and make it easier to hire. A lower job security makes it easier for businesses to hire. Can reduce unemployment without affecting the budget, but it increases income inequality and reduces protections for low-income workers.
INFLATION POLICIES: DEMAND-PULL
- The inflationary gap is caused by demand-pull inflation brought on by an increase in AD. Contractionary arrangements can diminish Promotion to take the economy back to likely result.
- Time lags, political constraints, and the inability to fine-tune the economy are all factors that contribute to a contractionary fiscal policy’s ability to deal with rapid inflation. Contractionary monetary policy’s quick implementation and independence are also factors. supply-side policies cannot be utilized because demand-pull inflation has demand-side causes and a lag, and supply-side policies have a conflict with objectives. However, over extended periods, these policies can shift the LRAS curve to the right and reduce inflation.
INFLATION POLICIES: COST-PUSH
- The SRAS curve shifts to the left as a result of cost-push inflation brought on by an increase in production costs or supply-side shocks (higher price level, lower output, and rise in unemployment).
- There is no universal solution to the issue, and demand-side policies are inappropriate.
- Contractionary monetary policy is used by some governments to lower AD, but it will lead to recession. Usually, the cause is the basis for the policy. If a wage increase is the cause of inflation, efforts may be made to reverse the increase.
- The solution is more difficult to find if the inflation is brought on by an increase in the cost of imported inputs. In the case of oil, nations attempted to use alternative forms of energy to reduce demand.
- Policies that encourage competition or break monopolistic powers can be used if firms with monopolistic powers raise prices and cause inflation.
- Policies designed to reduce a nation’s reliance may be implemented in the event of inflation.
INFLATION POLICIES: INFLATION TARGETING
- A type of monetary policy known as inflation targeting does not take into account the type of inflation and instead maintains it at a predetermined rate.
- It is successful in keeping inflation rates low and stable, but it loses the ability to pursue other goals. .
We Are Here To Help You To Excel in Your Exams!
Book your free demo session now, head office.
- HD-213, WeWork DLF Forum, Cyber City, DLF Phase 3, DLF, Gurugram, Haryana-122002
- +919540653900
- [email protected]
Tychr Online Tutors
IB Online Tutor
Cambridge Online Tutor
Edexcel Online Tutors
AQA Online Tutors
OCR Online Tutors
AP Online Tutors
SAT Online Tuition Classes
ACT Online Tuition Classes
IB Tutor in Bangalore
IB Tutors In Mumbai
IB Tutors In Pune
IB Tutors In Delhi
IB Tutors In Gurgaon
IB Tutors In Noida
IB Tutors In Chennai
Quick Links
Who We Are?
Meet Our Team
Our Results
Our Testimonials
Let’s Connect!
Terms & Conditions
Privacy Policy
Refund Policy
Recent Articles
Inside gwu: george washington university admissions, inside brown university: demystifying admission requirements, emerson college admission requirements: a closer look, bowdoin admission requirements: your path to excellence, international ib tutors.
IB Tutor in Singapore
IB Tutor in Toronto
IB Tutor in Seattle
IB Tutor in San Diego
IB Tutor in Vancouver
IB Tutor in London
IB Tutor in Zurich
IB Tutor in Basel
IB Tutor in Lausanne
IB Tutor in Geneva
IB Tutor in Ontario
IB Tutor in Boston
IB Tutor in Kowloon
IB Tutor in Hong Kong
IB Tutor in San Francisco
IB Tutor in Dallas
IB Tutor in Houston
IB Tutor in Chicago
IB Tutor in New York City
IB Tutor in Brooklyn
IB Tutor in Washington
IB Tutor in Berkshire
IB Tutor in Sussex
IB Tutor in Melbourne
IB Tutor in Western Australia
Ⓒ 2023 TYCHR ACADEMY | All Rights Reserved
Download Our selected list of 30+ IB IA Ideas for FREE!

ANNOUNCEMENT
Download our Successful College Application Guide developed by counselors from the University of Cambridge for institutions like Oxbridge alongside other Ivy Leagues . To join our college counseling program, call at +918825012255
We are hiring a Business Development Associate and Content Writer and Social Media Strategist at our organisation TYCHR to take over the responsibility of conducting workshops and excelling in new sales territory. View More
Demand Side Policies

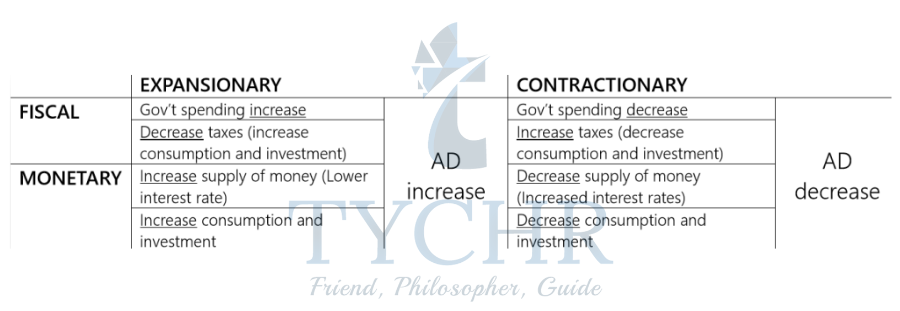
Demand Side Policies are attempts to increase or decrease aggregate demand to affect output, employment , and inflation . Demand Side Policies can be classified into fiscal policy and monetary policy .
In general, demand-side policies aim to change the aggregate demand in the economy. Aggregate Demand is made up of Consumer Spending + Government Spending + Investment + Net Exports (exports-imports). So anything that affects these factors will affect demand. We tend to use demand-side policies for short-term changes – if inflation is getting too high, we can increase interest rates to cool the economy down.
Demand-side policies may be expansionary or contractionary. Expansionary policies are intended to stimulate spending in a recessionary economy; contractionary policies designed to reduce expenditures in an inflationary economy.
On the other hand, policymakers also have the option of using Supply Side Policies . These policies are aimed at increasing Aggregate Supply (AS), a shift from left to right. Successful supply-side policies lower the natural rate of unemployment .
Fiscal Policy
Fiscal Policy refers to policies affect government spending or tax policy.
In Keynesian economics, the level of Aggregate Demand determines the output. To increase production, we would need to increase aggregate demand. Thus, fiscal policy can be used to increase Aggregate Demand. These policies can be used to help close the deflationary gap .
Fiscal expansions tend to be politically popular (i.e., more spending and/or less taxes) and thus easier to execute. However, fiscal expansions can make existing deficits worse and add to the national debt, which may not be sustainable. Contractionary policies (spending cuts or higher taxes) tend to be politically unpopular and less likely to be used even if required by economic conditions.
Monetary Policy
Monetary Policy refers policies that affect the interest rate or money supply.
Monetary policy involves the country’s central bank controlling the interest rate and money supply. Monetary policy affects Aggregate Demand (AD). An expansionary monetary policy increases Aggregate Demand, while a contractionary monetary policy decreases AD.
Monetary expansions are often less efficient and less predictable as compared to monetary contractions. For example, if the Central Bank is concerned about weak economic growth or relatively high rates of unemployment. The policy reaction would be to increase bank reserves (excess reserves) through open market purchases. Banks would then be expected to convert these excess reserves into loans with their customers. However, if banks are pessimistic about their future reserve position (expecting higher than usual withdrawal activity or fewer new deposits), they might just sit on these reserves with no change in lending rates.
Open market operations that remove reserves from the banking system will require that these banks reduce lending activity and allowing competition for fewer available loans to push interest rates upward. Higher interest rates will always make certain investment projects unprofitable thus leading to the abandonment of these projects.
Similar Posts:
- Expansionary Monetary Policy
- Discretionary Fiscal Policy
- Supply Side Economics
- Top 100 Economics Blogs of 2023
- Aggregate Supply And Demand
Leave a Comment Cancel reply
Save my name and email in this browser for the next time I comment.
A website for Edexcel students to study Economics and Business
- £ 0.00 0 items
Supply-side policies
Supply side policies aim to either increase the quality/quantity of factors of production or to improve market efficiency, increasing the productive potential of the economy.
A) Distinction between market-based and interventionist methods
Interventionist methods occur when the government actively gets involved in the market in ways such as, increasing government spending on education or reducing taxation in order to encourage investment. On the other hand, market-based methods try to keep the government out of the economy, allowing markets to act freely.
B) Market-based and interventionist policies:
To increase incentives
A good example of this is a reduction in income tax. By doing so it encourages more people to enter the workforce. This is because they will get to keep more of their income, meaning if they do work, they’ll get more disposable income. As there are now more workers available, more goods/services can be produced, causing LRAS to increase. In addition to this, the reduction in income may also incentivise those currently working, to work harder.
Another example is a reduction in corporation tax. This allows firms to keep more of their profits, incentivising them to spend that profit on investment. An increase in investment would increase the quantity/quality of factors of production.
To promote competition
Privatisation can increase efficiencies through increased competition. By letting the free market provide certain goods/services it allows for efficient market outcomes as a result of the profit motive. Unlike the government, private firms can make a profit and therefore it is in their best interest to reduce costs and work as efficiently as possible so that they are able to compete against other firms. The increase in market efficiency causes LRAS to increase.
In addition to this, deregulation also increases competition as it encourages more firms to enter the market. In order for existing firms to compete with new entrants, they must become more efficient. This causes an increase in market efficiency.
To reform the labour market
Policies could be introduced in order to tackle the geographical immobility of labour, such as improving information on job vacancies and subsidising worker relocation. This improves labour market flexibility as it reduces the problem of labour shortages in certain areas and labour surpluses in other areas.
The benefits system can be reformed to encourage workers to take available jobs. For example, welfare benefits could be reduced, increasing the incentive for people to take the jobs available to them as it would result in a bigger increase in disposable income than before.
Minimum wages and trade unions can cause wages in the labour market to be fixed above the equilibrium wage rate. This causes an excess in the supply of labour meaning that the labour market is not working at equilibrium, resulting in inefficiencies. By reducing or abolishing the national minimum wage and trade union power, it allows wages to fall to the equilibrium wage rate, thus increasing the efficiency of the labour market.
To improve skills and quality of the labour force
This can be achieved through a number of ways, the main one being increased government spending on education. The impact of this will be an increase in the quality of labour. A higher quality workforce will be more productive. Therefore, the productive capacity of the economy will increase as the potential amount of goods/services that can be produced within the economy using existing factors of production sustainably has increase, shifting LRAS to the right.
To improve infrastructure
Increased government spending on infrastructure such as roads and railway services increases productivity and efficiency as less time is wasted through excessive travel times. This will cause LRAS to the right. It can also help to reduce market failures such as, excessive pollution or congestion.
C) Use of AD/AS diagrams to illustrate supply-side policies

Supply side policies increase the productive capacity of the economy (Y1 to YFE) as the maximum amount of goods/services that can be made using existing factors of production sustainably increases. This causes a fall in the general price level (P1 to P2) as there is less pressure on existing factors of production. For example, at Y1 the economy was operating at full capacity, however, the increase in LRAS moved the economy to an equilibrium that is now less than the new full employment rate of the economy (YFE). This spare capacity can be shown by the difference between YFE and Y2.

Supply side policies can also be shown on a classical aggregate demand and supply curve. Supply side polices cause an increase in long run aggregate supply (LRAS1 to LRAS2). This causes an increase in real GDP (Y1 to Y2) and a reduction in the price level (P1 to P2).
D) Strengths and weaknesses of supply-side policies
Expensive
Interventionist supply side policies such as investment in infrastructure can be extremely expensive for the government to finance.
Read more…
- Past Papers
- Theme 1: Introduction to markets and market faliure
- Theme 2: The UK economy – performance and policies
- Theme 3: Business behaviour and the labour market
- Theme 4: A global perspective
- Revision Guides
Demand and Supply Essay
Introduction.
Economics plays an important role in the healthcare industry in the US. The relationship between different organizations and individuals involved in the production and consumption of health goods and services in the US is a complex one. The economic need of an individual in terms of healthcare is main idea behind the consumption while organizations provide the above needed services.
The healthcare industry is subject to all the economic trends through production of goods and services which in this case are the drugs, equipment and the services rendered by medical professionals. Additionally, it’s also shaped by the forces of demand and supply; demand in this case denoting the willingness and capacity of consumers to pay for the healthcare products on offer.
Supply on the other hand denotes the presence centers that provide medical services and the ability for the manufacturers of these products avail the products to the consumers. Besides the forces of demand and supply, there are economic variables including time, accessibility of drugs and services and user charges as applied in the industry.
The discussion will focus on the above principles of economics as they apply to the healthcare industry in the US. Precisely, the discussion will focus on the supply and demand of endocrinology services in the US. There will also be a discussion on the economic relationship between the availability of these services in the US and the economic variables involved especially cost and access.
Endocrinologists help in the treatment of endocrine disorders associated with diabetes conditions. Besides cancer and heart disease, diabetes is ranked as the other major disease among the American population.
Demand Side
The rise in the cases of diabetes, has led to a rise in demand of endocrinology services in the US. On the other hand however, the number of endocrinologists entering the market in the US has reduced considerably. The situation has therefore created a supply demand mismatch in the availability of these services.
According to Stewart (2008, p. 1), private clinics, publicly run institutions, academic medical centers and the pharmaceutical industry have seen their needs for endocrinologists increase. According to him, the demand for endocrinology services is going to rise further considering the fact that over 44 million people in the US need their services. Additionally, over 50% of the US population being obese means that endocrinologists will be needed more in the coming years.
Supply Side
The above demand is against a supply of slightly above 5000 endocrinologists available in the US according to a 2006 survey. Over 1500 of these are not primary care providers, leaving an average of 4000 endocrinologists in active practice. The above scenario clearly shows demand outstripping supply.
According to Mercer (2009, p. 1), the demand for endocrinology services is likely to rise further as many of the professionals reach retirement age in this decade. The above demand – supply mismatch has had its consequences felt by the consumers of these services in the US.
Economic Variables
Basic economics dictate that the most likely effect when demand outstrips supply is the rise in price of goods and services. Sometimes, it may also affect the quality of the service being delivered and how it’s being delivered. Mercer (2009, p. 1) asserts that the disparity in the demand and supply of endocrinologists in the US has resulted in the failure to treat endocrinology patients in the traditional office model.
Stewart concurs in his analysis when he says that the shortage of endocrinologists negatively impacted access to care by patients with diabetes, obesity, adrenal disease and thyroid cancer. This shortage of endocrinologist has led to limited access and care of endocrinology patients. There are verified reports of patients waiting up to 6 months to gain access to an endocrinologist. As expected, the costs associated with accessing the services have risen.
This is partly because of the negative consequences of the failure to treat the condition appropriately due to waiting time and largely because of the economical factor of less supply. Instead they have adopted the volume solution to resolve the problem. Additionally, the industry has adopted an approach of engaging primary care physicians to handle endocrinology patients. This primarily aims at availing wide access to the services to the people who need them.
Rizza et al (2003, p. 1985) asserts that the demand for endocrinologists will exceed supply for the next two decades at least up to the year 2020. According to a supply model developed by the Rizza, the difference between the demand and supply of these services will reduce in the first decade of the 21 st century as new professionals enter the field.
However, expected retirement of many endocrinologists who will be above 50 years during the decade will widen the demand and supply mismatch. There is sufficient reason to believe that improved supply of endocrinologists to the market in the US will eliminate most of the problems brought by the shortage.
There is need to prop up the supply of endocrinologists in the US through the implementation of measures influenced by the factors of supply. First, it’s important that the trends in residence fellowships be improved so that the number of endocrinologists who complete the fellowships every year increases.
Secondly, there is need to raise the retirement age of medical practitioners but the raise should mainly target the endocrinology profession. That way the rate of attrition from the profession will be stemmed and effectively improving supply of the professionals. The above factors are expected to boost supply of the professionals to the market to end the bridge the gap between their demand supply deficits.
The above analysis represents the integration of the principles of economics especially demand and supply in the healthcare industry. Medical services in this case endocrinology are treated like any other commodity that I available in the market for the highest bidder. Like in pure economics, the economic variables of cost and access to good and services are affected by demand and supply.
A rational analysis on the number of professionals in the field of endocrinology in the US and the demand that is currently available easily suggests a deficit in supply. The mismatch between the forces of demand and supply therefore has led to the rise n the costs associated with endocrinology services.
Additionally, access to the services has also been affected. Increasing the supply of this service will weigh down on demand and an equilibrium position will be achieved. The measures suggested in the last part of the discussion are meant to increase the supply through the supply chain which in this case is the training institutions.
Mercer, A. (2009). Supply and Demand. Diabetes Health. Retrieved from https://www.diabeteshealth.com/
Rizza, A.R. et al. (2003). A model to determine workforce needs for endocrinologists in the US 2020*. Journal of Clinical Endocrinology & Metabolism 88(5).1970- 1987.
Stewart, A. (2008).The United States Endocrinology Workforce: A Supply-Demand Mismatch. The Journal of Clinical Endocrinology & Metabolism April 1, 2008 vol. 93 no. 4 1164-1166.
- Chicago (A-D)
- Chicago (N-B)
IvyPanda. (2023, December 8). Demand and Supply. https://ivypanda.com/essays/demand-and-supply/
"Demand and Supply." IvyPanda , 8 Dec. 2023, ivypanda.com/essays/demand-and-supply/.
IvyPanda . (2023) 'Demand and Supply'. 8 December.
IvyPanda . 2023. "Demand and Supply." December 8, 2023. https://ivypanda.com/essays/demand-and-supply/.
1. IvyPanda . "Demand and Supply." December 8, 2023. https://ivypanda.com/essays/demand-and-supply/.
Bibliography
IvyPanda . "Demand and Supply." December 8, 2023. https://ivypanda.com/essays/demand-and-supply/.
- Endocrinology: Regulation of Growth Hormone
- The Intersex Society of North America
- Aspects of Health Care Delivery System
- Type 2 Diabetes Project Results Dissemination
- Comparing the Latin American and the U.S. Healthcare Systems
- Department-Wise Profile of a Specialty Hospital: How It Works in Modern Conditions
- Diabetes Mellitus: Types, Causes, Presentation, Treatment, and Examination
- Organic Foods and the Endocrine System
- Competitor Profile of Montefiore Medical Center and New York–Presbyterian Hospital
- Infertility and Pain Management Practice
- Impact of HIV/AIDS on Microeconomics
- Two Industries in Different Market Structures
- Supply and Demand: The Case of Milk
- Microeconomics Module – Supply and Demand
- Microeconomics Demand: Utility and Marginality
IMAGES
VIDEO
COMMENTS
Demand-side and supply-side policies are policies used by the government and the Bank of England in the UK to influence both aggregate demand (AD) and long-run aggregate supply ... It will be argued in this essay that both types of policy can be effective but that in order to fully control the inflation rate in the UK a combination of policies ...
In a recession, supply-side policies cannot tackle the fundamental problem which is lack of aggregate demand. Time. All supply-side policies take a long time to have an effect. Some policies, such as education spending may not influence the economy for 20-30 years. Related. Supply-side policies in the UK; Supply-side policies for reducing ...
Privatisation, deregulation, tax cuts, free trade agreements (free market supply side policies) Improved education and training, improved infrastructure. (interventionist supply side policies) Demand side policies are important during a recession or period of economic stagnation. Supply side policies are relevant for improving the long run ...
propositions which comprise supply side economics. This neglect is regrettable, since it has allowed die-hard critics of the policy posi-tions which are derived from the supply side analysis to pin a snake-oil label on both the analysis and the policies. In fact, supply side economics affords no magical nostrums. Nor is it properly perceived
Demand side policies: Economic policies of fiscal & monetary to influence AD. Supply side policies: Microeconomic policies focusing on enhancing the long run output potential in the economy. The policies target specific markets such as labour, capital & competition. Policies are market orientated or interventionist.
The two main instruments of monetary policy include. Incremental adjustments to the interest rate (usually not more than 0.25%); Quantitative easing which increases the supply of money in the economy. The Central Bank creates new money and uses it to buy open-market assets; When a policy decision is made, it creates a ripple effect through the economy and this effect is known as a transmission ...
Here is a revision essay plan on this question: "Assess policies that might be most effective in reducing the size of the UK current account deficit in the future." In 2018, the UK current account, saw a deficit of £82 billion, compared with £68 billion in 2017. The current account deficit was 3.9% of GDP in 2018 compared with 3.3% in 2017.
Demand-side policies will be successful if there is spare capacity in the economy (Y1 to Y2). But from AD3 to AD4, there is only inflation. This diagram shows that an increase in AD will cause an increase in Real GDP in the short run. However, as prices increase firms face an increase in their wage bill so the SRAS shifts to the left.
The Science of Supply and Demand. by David F. Perkis. "A body in motion tends to stay in motion unless acted on by an out-side force." —Isaac Newton. Science Is Everywhere. We live in a world governed by the laws of science. From gravity, to electromagnetism, to sound waves, our lives are filled with scientific phenomena that structure and ...
Abstract. Supply-side economics made a critique of the Keynes' Law, which means that "demand creates its own supply." In contrast, it defended the idea of "supply creates its own demand ...
Supply-side policies aim to shift the long-run aggregate supply (LRAS) There are two categories of supply-side policies. Interventionist and market-based. Interventionist supply-side policies require government intervention in order to increase the full employment level of output. These are mainly used to correct market failure.
Supply-side policies can be extremely useful in generating long term growth, lowering average price levels, and creating new jobs in an economy; The five goals of Supply-side policy . When successful, supply-side policies have the following effects on the government's macroeconomic objectives Economic growth: potential national output increases leading to higher real gross domestic product (rGDP)
Example of Demand-Side Economic Policies . The financial crisis of 2008 sparked the use of demand-side economic policy by the U.S. government. The Obama administration lowered interest rates.
UK University Admission Calculator. Demand and Supply side policies are policies that overlook the whole operation of the economy. Access all further information, downloading the Demand-Side and Supply-Side Policies notes provided by TYCHR.
Demand Side Policies are attempts to increase or decrease aggregate demand to affect output, employment, and inflation. Demand Side Policies can be classified into fiscal policy and monetary policy. In general, demand-side policies aim to change the aggregate demand in the economy. Aggregate Demand is made up of Consumer Spending + Government ...
Supply side policies can also be shown on a classical aggregate demand and supply curve. Supply side polices cause an increase in long run aggregate supply (LRAS1 to LRAS2). This causes an increase in real GDP (Y1 to Y2) and a reduction in the price level (P1 to P2). D) Strengths and weaknesses of supply-side policies. Expensive
Economics Supply Side Policy essay. discuss the extent to which supply side policies can be effective in improving macroeconomic objectives supply side. Skip to document. University; ... Law of demand [Wiley Trading] Ilian Yotov - The Quarters Theory The Revolutionary New Foreign Currencies Trading Method (2010 , Wiley)
According to a supply model developed by the Rizza, the difference between the demand and supply of these services will reduce in the first decade of the 21 st century as new professionals enter the field. However, expected retirement of many endocrinologists who will be above 50 years during the decade will widen the demand and supply mismatch.
A demand-side policy is a macroeconomic policy which is aimed at changing the level of aggregate demand (defined by consumption + investment + government spending + net exports). Supply-side policy. A supply-side policy is a macroeconomic policy which is aimed at increasing an economy's productive potential, thus boosting its level of ...
Supply-side economics, a policy advocating lower taxes and less government regulation of business, gained popularity during the 1970s, a decade in which the U.S. economy suffered from the chronic economic problem of stagflation. High unemployment, high inflation, and sluggish economic growth characterized stagflation, which worsened during the ...
Demand/Supply-side Policies are macroeconomic policies that overlook the whole operation of the economy. They are to help to stabilize the economic environment for sustainable economic growth. The policy instruments are categorised as demand and supply-side policy in which Monetary and Fiscal policy being the two key pillars of demand-side ...
Supply-side Policy Measures. When successful, supply-side policies have the following effects on the government's macroeconomic objectives. Economic growth: potential national output increases leading to higher real gross domestic product (rGDP) Inflation: a greater supply in the economy results in reductions in the prices of goods/services ...
B Supply-side policies are intended to increase the long-run trend rate of economic growth. C Supply-side policies are designed to reduce the size of a negative output gap. D Supply-side policies ensure increased capacity utilisation in the economy. urious Education. Which one of the following statements relating to the use of supply-side ...