Welcome Guest!
- IELTS Listening
- IELTS Reading
- IELTS Writing
- IELTS Writing Task 1
- IELTS Writing Task 2
- IELTS Speaking
- IELTS Speaking Part 1
- IELTS Speaking Part 2
- IELTS Speaking Part 3
- IELTS Practice Tests
- IELTS Listening Practice Tests
- IELTS Reading Practice Tests
- IELTS Writing Practice Tests
- IELTS Speaking Practice Tests
- All Courses
- IELTS Online Classes
- OET Online Classes
- PTE Online Classes
- CELPIP Online Classes
- Free Live Classes
- Australia PR
- Germany Job Seeker Visa
- Austria Job Seeker Visa
- Sweden Job Seeker Visa
- Study Abroad
- Student Testimonials
- Our Trainers
- IELTS Webinar
- Immigration Webinar

IELTS Writing Task 1 – Line Graph

Updated On Jan 25, 2024
Share on Whatsapp
Share on Email
Share on Linkedin

IELTS Writing Prediction Questions for 2024
IELTS line graphs
In IELTS Writing task 1 of the academic section, there will be a visual representation or a diagram on which you have to write a paragraph. One of these visual representations may be pie charts.
Sometimes, in the IELTS examination , you are asked to explain a Line graph. The IELTS line graph shows how data changes over time. These line graphs will have 2 axes, one is X-axis and another is Y-axis.
The X-axis shows the time period and the Y-axis shows what is being measured. The line graph highlights the trends when the data goes up and down. You should take only 20 minutes to complete this task and it should be a 150-word essay.
Line graph – An example:

Types of Line Graphs:
There are three types of line graphs. They are:
- Simple line graph
- Multiline graph (or) Polyline graph
- Compound line graph
Simple Line Graph:
Definition: These types of graphs have just a single line plotted on them.

Sample Answer
The given image depicts a line graph representing the trend in the occurrence of X disease in Someland from 1960 to 1995.
The line graph represents the presence of X disease in Someland in varying numbers at different time intervals until it is wiped out entirely from the place.
It is clear from the line graph that the number of people affected by X disease did not cross 100 between 1960 -1965. The number of affected individuals began rising after the year 1965 and reached 200 in 1970 and 500 in 1975 respectively. The occurrence of X disease remained stagnant between 1975-1980 at 500 affected individuals. After the year 1980, the number of cases took a downward trend, falling down to almost 350 in 1985 before being completely eradicated by the year 1990. The number of people affected by X disease in Someland has been zero from 1990 till 1995.
Multiline graph (or) Polyline graph Task 1:
Definition: They are commonly used for comparison. These types of graphs have more than one line. ( on the same axis)
The graph portrays the consumption of three kinds of spread, namely, Margarine, Lowfat and reduced spreads and butter, over 26 years, from 1981 to 2007.
It is evident that butter and margarine were the primary spreads used until the introduction of low-fat and reduced spreads.
The staple spread from the early 1980s till the early 1990s was butter. The consumption of margarine followed a fluctuating trend over the years, from 1981 to 1986. The consumption decreased but then rose till 1991 and remained stagnant till 1996 after which it started declining. The use of low-fat and reduced spread began from 1996 and rose sharply from the first year till 2001 after which its preference decreased.
With regards to quantity, butter peaked at about 160 grams after which it followed a downward trend. The quantity of Margarine was within 80-100 grams for 20 years till 2001 after which it fell to 40 grams in 2007. The number of low-fat spreads crossed 80 grams in 2001 after which its consumption quantity fell.
Compound line graph:
Definition: It is an advanced version of the multi-line graph. The area between two lines is shaded indicating the size of that part.

The given graph shows the frequency of three different kinds of vehicles, which are, vans, trucks and tricycles on a road at different times of the day.
It is clear from the graph that at any point in time, the number of vans on the road are the highest among the three vehicles, followed by trucks and then tricycles. The peak hour of vans and trucks falls between 2-3 pm.
The number of vans on the road increases from 1-2 pm till 2-3 pm and then gradually decreases. The number of trucks on the road remains the same till 2-3 pm after which their number also starts declining. The number of tricycles is highest at 1-2 pm and then it follows a downward trend all throughout the day.
The road in question is dominated by vans for most of the day and trucks are also quite frequent during the afternoon. The number of tricycles are less as compared to the other two types of vehicles.
Tips for IELTS Writing Task 1 Line Graph 2022
- In the introduction part, you can paraphrase the question asked or the topic of the essay.
- When you explain the overall trend, identify the main feature and explain it.
- Ensure that each paragraph has examples that are percentages or numbers to support the sentence written as an explanation.
- You can look into the various lessons available on the line graph in order to answer the complex questions.
- The last tip is to practice as much as possible so that you get a good hold on what to write in the examination when questions become complex.
- You also need to use suitable verbs, nouns, adverbs, adjectives, prepositions related to time.
Writing the exam without practicing is a waste because you will not be able to understand anything in the exam. It may become complex and test-takers may skip the question which in turn will reduce your IELTS band score .
Here are the 10 examples for the IELTS Writing Line Graph Task 1 2022:
Also check :
IELTS Writing recent actual test
Frequently Asked Questions
What is a line graph?
Is there a dedicated vocabulary for line graph?
What is trend in a graph?
What is the structure used to describe a line graph?
Is conclusion required for writing task 1 – Line graph?
Practice IELTS Writing Task 1 based on report types

Effective IELTS Essay Connectors for Writing Task 2 & Task 1
Janet had been an IELTS Trainer before she dived into the field of Content Writing. During her days of being a Trainer, Janet had written essays and sample answers which got her students an 8+ band in the IELTS Test. Her contributions to our articles have been engaging and simple to help the students understand and grasp the information with ease. Janet, born and brought up in California, had no idea about the IELTS until she moved to study in Canada. Her peers leaned to her for help as her first language was English.
Explore other sample Line Graphs

Nehasri Ravishenbagam

Janice Thompson

Post your Comments

Khairul Alamgir
Posted on Sep 26, 2021
Its very nice your presentation.
Recent Articles

Raajdeep Saha

Our Offices
Gurgaon city scape, gurgaon bptp.
Step 1 of 3
Great going .
Get a free session from trainer
Have you taken test before?
Please select any option
Get free eBook to excel in test
Please enter Email ID
Get support from an Band 9 trainer
Please enter phone number
Already Registered?
Select a date
Please select a date
Select a time (IST Time Zone)
Please select a time
Mark Your Calendar: Free Session with Expert on
Which exam are you preparing?
Great Going!

- Ielts Speaking Part 1
- Ielts Speaking Part 2
- Ielts Speaking Part 3
- IELTS Writing Task 2
- IELTS Writing Task 1
- IELTS Writing
IELTS Writing Task 1 Line Graph | How to Write a Band 9

IELTS Writing Task 1 Line Graph | How to Write a Band 9 | Step by step Guide
In this lesson, I will give you the general process for writing task 1 and how to apply it in each type of chart or graph. First, you need to know the common structure of task 1 before you start.
Task 1 includes 20 minutes and asks you to describe the data which is shown in maps, flow diagrams or image comparison charts . Therefore, to maximize your score, remember to follow the 3-step process below:
- Step 1: Analyze the general task and data (static data or movement data, timescales and units?)
- Step 2: Group data, identify common trends and exceptions and choose the main features
- Step 3: Writing essay (using paraphrased words and data collected from step 1 and 2 to finish)
Now let’s begin with the first type of graph: “the line graph”
Look carefully at the line graph below:
So, following step 1: read the topic carefully and identify the important information :
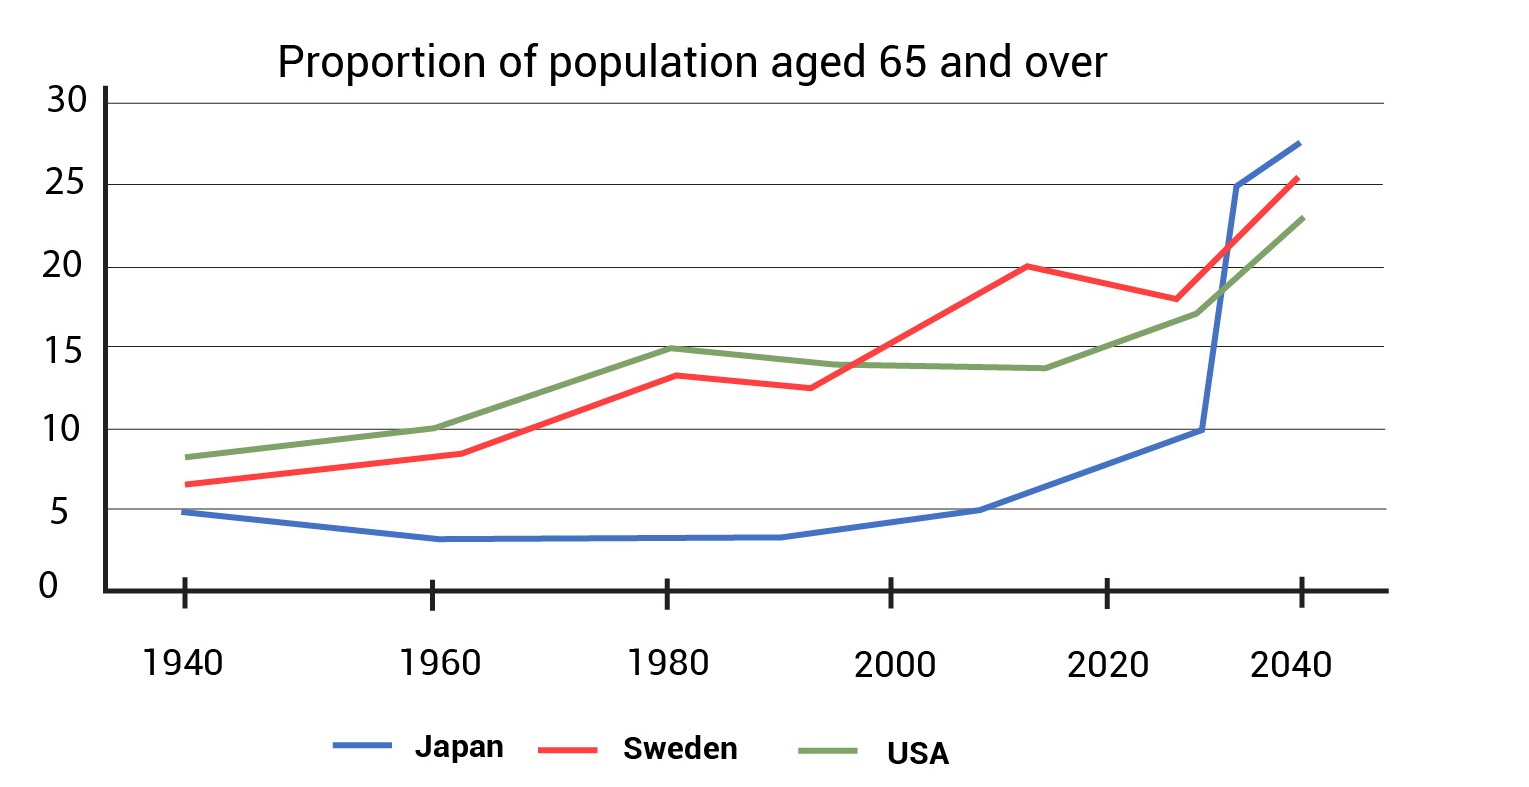
Take a closer look at the graph, you can see on the vertical axis: the number is displayed in percentage and on the horizontal axis, we have timescales from 1940 to 2040. Below the graph, we also see three countries: Japan in blue, Sweden in red and USA in green.
For the second step, you should follow the given structure as I mention here and apply for all types of graph or chart.
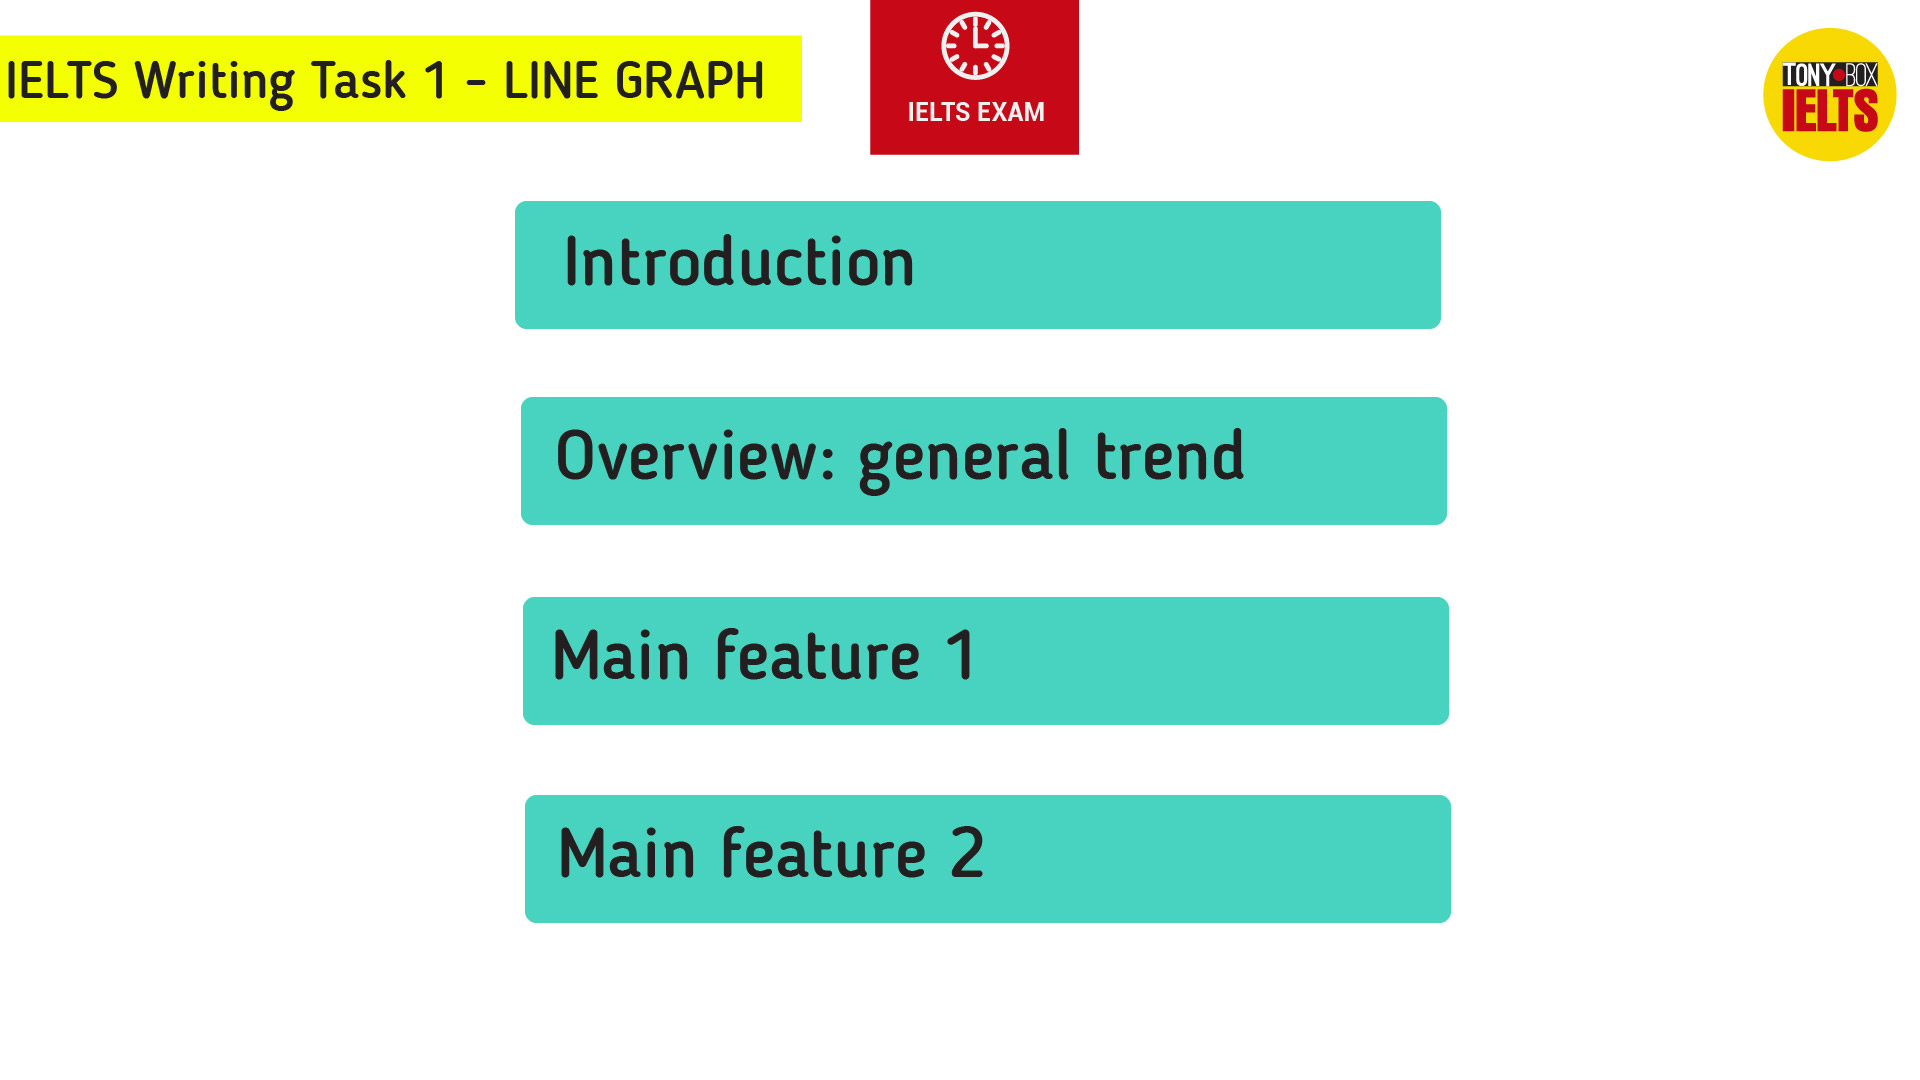
The outline will include 3 parts: the introduction, the body paragraph, and the conclusion. However, to task 1, the conclusion is optional, so you can normally ignore it and finish the essay with only the first two parts.
The first part is the introduction : All you need to do is paraphrasing the provided question in your own language and it needs less than two sentences .
And the second part is body paragraph . In this part, you will have the first paragraph for an overview , which means that you will write about the general trend of the graph : increase, decrease or fluctuation and so on. The second and third paragraphs are the main features with detailed figures . So normally, you will have a total of 4 paragraphs with a length of 7 or 8 sentences .
Ok, let’s analyze one specific example to get the band 9 answer.
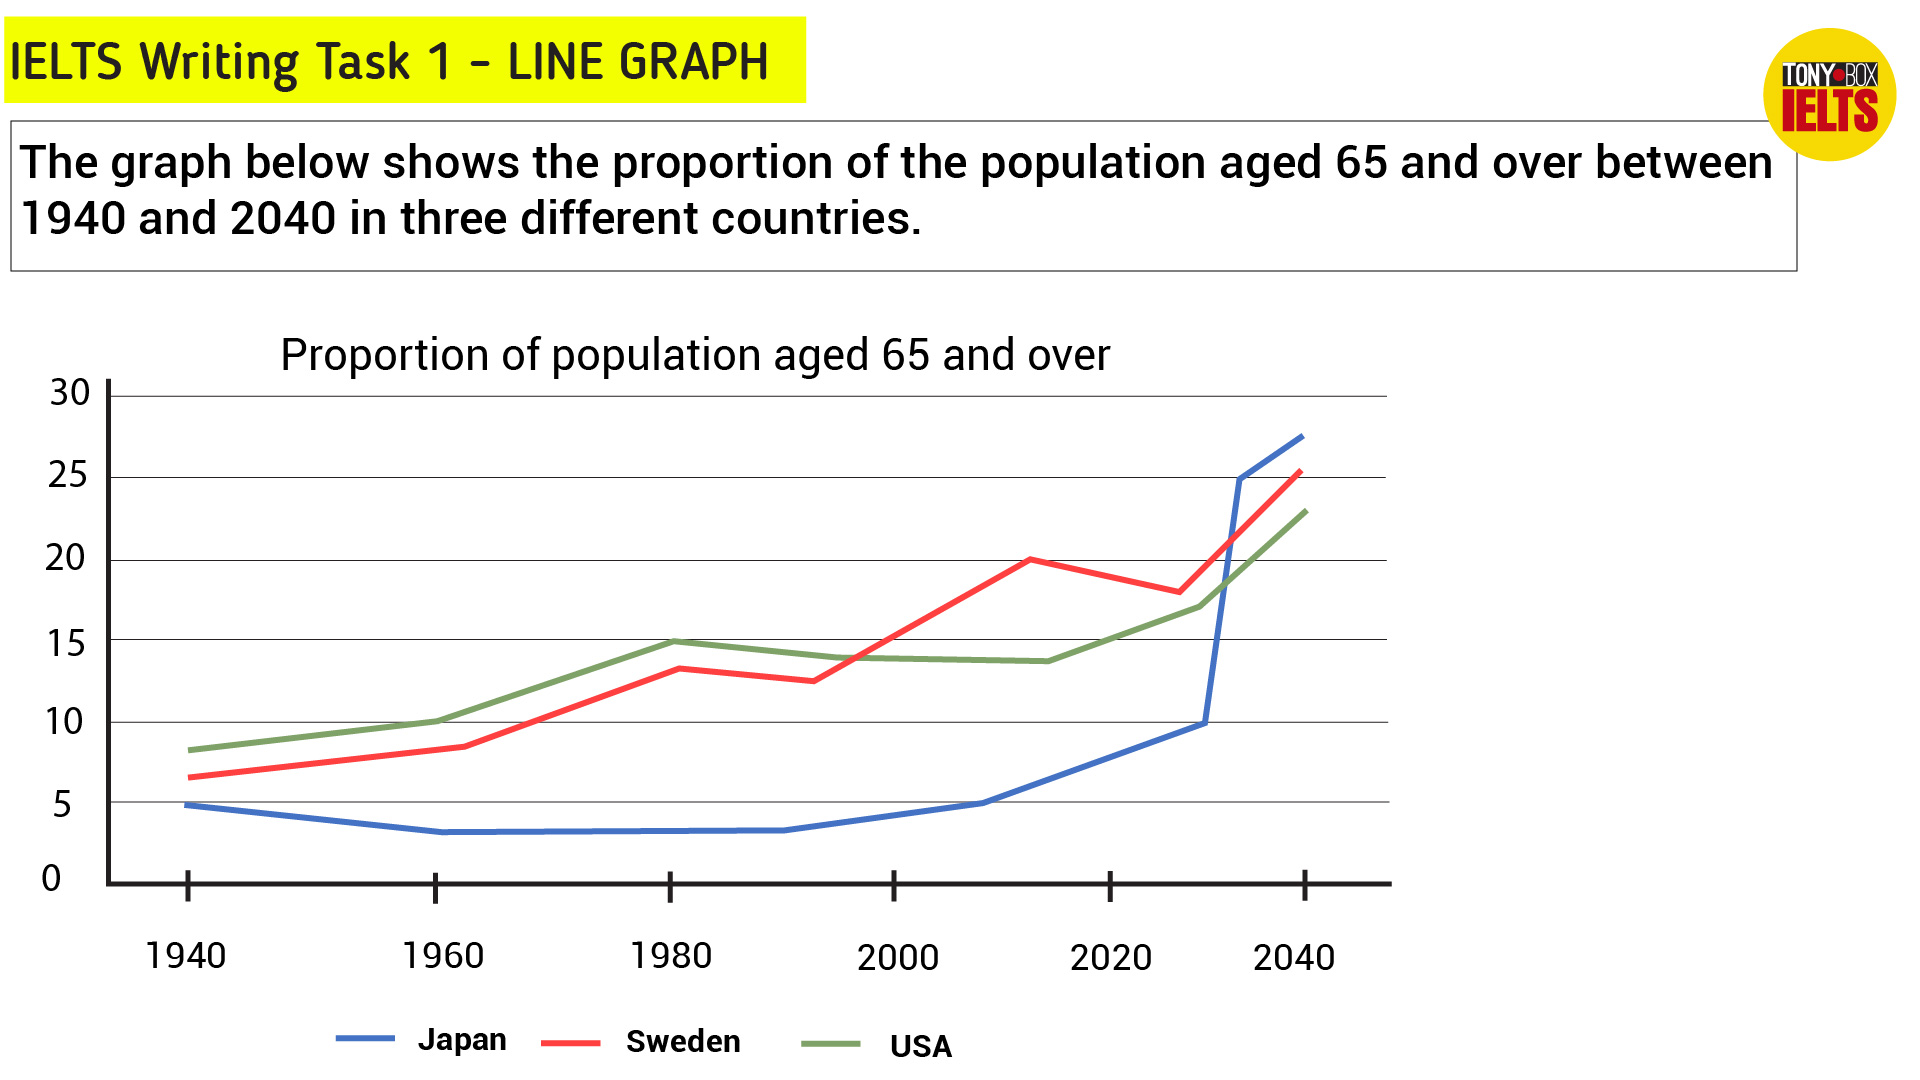
The graph below shows the proportion of the population aged 65 and over between 1940 and 2040 in three different countries.
For the introduction , you just need to paraphrase the topic like that:
The line graph compares the percentage of people aged 65 or more in Japan, Sweden, and the USA over a period of 100 years.
As you can see, I change the graph into the specific type of graph: line graph . You can give the specific type of graph like the bar chart, table or diagram or just keep it as simple as “graph”. But i f the topic says the exact kind of graph, you don’t need to change anything.
Next, I use “ compares ” instead of “shows”. You can rewrite with some similar words like “display, illustrate, reveal or give the information” to explain the graph.
To describe the proportion , you can give the phrase: the percentage of people to paraphrase for the proportion of the population.
For three different countries , you can add more detail by giving the name of countries shown in the graph like “ Japan, Sweden, and the USA” . It helps your essay more specific and understandable.
And finally , the graph always provides the time period on the topic. For example, for the above graph, I change the phrase “ between 1940 and 2040” into over a period of 100 years .
So for the timescale, you can use some structures like “from 1940 to 2040”, “over a period of 100 years” or “between 1940 and 2040” . We only need to learn the maximum of 3 phrases to apply for all types of graph , don’t need more than that.
So when you look at the introduction I give, you can totally understand what the graph shows, the timescale, and the areas described.
Now move on to the body paragraph, it is necessary to write the overview of the graph which consists of the general trend or movement of the line, but it is no need to give specific information or data like numbers, dates or percentages, just “key information”.
So look back at the line graph,
You can easily note that all three countries: Japan, Sweden, and the USA go up from 1940 to 2040 and among them, Japan has the most increase . ( chỉ vào hình)
In fact, there should have around 2 or 3 features for the overview graph. Here is my view:
It is clear that the proportion of elderly people increases in each country between 1940 and 2040. Japan is expected to see the most dramatic changes in its elderly population.
It is noticeable that I only say the proportion in each nation increases, not giving a detailed percentage. I also add the specific time between 1940 and 2040 because the first part introduction, I just mention a period of 100 years. In addition, because the general trend is all onwards, so I choose to add more detail by describing Japan as the most increase amount.
If the trend is different, you can try using some structures like while, however, in contrast, and so on.
Another important thing you should remember is to use wisely the word repetition in your writing . For instance, the first time I use “ elderly people ” and the second time going for “ elderly population ”.
Next, you can also change word “increase” by some phrase verbs as “go up, rise” or using nouns like “see an increase, show a rise or experience an upward trend”. In contrast, instead of saying “see the most dramatic changes” , you can use other phrases including “experience the most dramatic increases” or “witness the sharpest changes”.
It is so good for you to learn to paraphrase when you practice writing task 1 as above.
After finishing the first two paragraphs: introduction and overview, it comes to main features including the detailed data, numbers or percentages which are displayed in paragraph 3 and 4 . It is better to group the data with similar features or trends so it is easier for an examiner to follow . In this case , we can group first by country. What I mean is that you can describe Japan ‘s percentage in the first paragraph, Sweden ‘s in the second paragraph and America ‘s in the third graph.
And the second option which I use to instruct you in this video is a group by timescales . It will be more logical as you follow the time period. Furthermore, by diving into separated time: the past and the future, you can compare data among countries as well as avoiding the mistake for the wrong usage of tense.
To be specific, in paragraph 3 , first we chose the period in the past from 1940 to around 2010 so the verb form must be the past tense. Second, I started the graph by describing the figures at the beginning of time.
In 1940, around 9% of Americans were aged 65 or over, compared to about 7% of Swedish people and 5% of Japanese people.
After that, because both the USA and Sweden had a similar upward trend until 1990 so I took 1990 as an important point and wrote:
The proportions of elderly people in the USA and Sweden rose gradually over the next 50 years, reaching just under 15% in 1990.
In addition, that period was also considered a key time because Japan had a different trend so I could compare among those nations as below:
By contrast, the figures for Japan remained below 5% until the early 2000s.
That’s the end of the third paragraph.
For the 4 th paragraph , I intend to analyze the future time so I choose the timescale from 2020 onwards , and you can see that they all go up so no need to say the same upward trend for those countries. Instead of, I decide to show one key point which illustrates one nation witnessing a soar, it’s Japan. So my writing is:
Looking into the future, a sudden increase in the percentage of elderly people is predicted for Japan, with a jump of over 17% in just 20 years from 2020 to 2040 .
As you can see, I mention the detail of data to support my key feature. For instance, a jump of over 17% and the time period 20 years from 2020 to 2040
And to sum up the paragraph , I choose the time at the end of the period to make a comparison between Japan, Sweden, and the USA . Here is my last sentence:
By 2040, it is thought that around 27% of the Japanese population will be 65 years old or more, while the figures for Sweden and the USA will be slightly lower, at about 25% and 23 % respectively.
In this sentence, I use “while ” to connect the countries, analyze the highest point of Japan in one side and Sweden and the USA on another side. I also use the comparative form of the adjective to compare like slightly lower.
Normally, you can choose any important points to describe but my advice is that you should choose the beginning and the ending period and some points during that period to analyze. It’s really easy to follow.
Now I will give you the completed essay for the line graph
In 1940, around 9% of Americans were aged 65 or over, compared to about 7% of Swedish people and 5% of Japanese people. The proportions of elderly people in the USA and Sweden rose gradually over the next 50 years, reaching just under 17% in 1990. By contrast, the figures for Japan remained below 5% until the early 2000s.
Looking into the future, a sudden increase in the percentage of elderly people is predicted for Japan, with a jump of over 15% in just 20 years from 2020 to 2040. By 2040, it is thought that around 27% of the Japanese population will be 65 years old or more, while the figures for Sweden and the USA will be slightly lower, at about 25% and 23 % respectively.
Read more:
- IELTS Writing Task 1 Table | Lesson 2: How to Write a Band 9
- IELTS Writing Task 1 Pie Chart | Lesson 3: How to Write a Band 9
- IELTS Writing Task 1 MAP: Lesson 4: How to Write a Band 9 | Step by step

RELATED ARTICLES MORE FROM AUTHOR

How to improve your IELTS Speaking Score in just 5 Steps

Phrasal Verbs for IELTS Speaking | Part 1 Topic: Education, Family, Travel, Environment

51 IELTS Phrases for Speaking & Writing You Must Know | Part 1


How to write IELTS writing task 1 line graph effectively?
1. introduction to ielts writing task 1 line graph.
A line graph, also known as Line chart, is a type of graph consisting of one or more lines, each of which shows the alterations over a period of time (weeks, months, years, decades, etc.).
There will be an x-axis (horizontal axis) and y-axis (vertical axis) in an IELTS Writing Task 1 Line Graph . To be specific, the x-axis often represents the time period while the y-axis gives information on what is measured. IELTS Line Graph, therefore, aims to highlight trends (peaks and troughs) among the data collected.
IELTS test-takers, on this task, need to produce a more-than-150-word essay to describe the Line graph without any personal points of view within around 20 minutes. As a consequence, a wide range of knowledge as well as vocabulary and strategies will definitely decide whether you can conquer Line Graph IELTS Task 1 questions or not.
Here are some Line Graph IELTS images:

In terms of structure and steps to write an IELTS Writing Task 1 Line graph essay will be discussed in the next parts.
2. Structure of IELTS Writing Task 1 Line Graph
Normally, there will be four different parts in an IELTS Writing Task 1 Line Graph essay:
2.1. Introduction
When first starting your IELTS Line graph essay, you need to write the Introduction in which these features should be mentioned:
- Main topic (e.g. the ratio of audiences entertaining radio and television)
- Place (e.g. the UK)
- Time (e.g. December 1992)
- Unit of measurement (% of people)
The Introduction part should be written in your own language by using synonyms, paraphrases, and different expressions without changing the meaning of the Line Graph question.
e.g. The line graph illustrates the proportion of people in the UK who watched TV and listened to the radio over 24 hours from October to December 1992.
2.2. Overview
Within around two sentences, you need to point out the general trend and special features in the IELTS Line Graph (the highest / lowest point, equal figures, etc.). However, no specific data will be touched upon in this part.
e.g. Overall, a significantly greater percentage of the TV audience watched in the evening while radio had the most listeners in the morning. Over the course of each day and night, more people watched TV than listened to the radio.
The Body part in IELTS Line Graph is also the same with other question types in IELTS Writing Task 1.
As usual, it is suggested that the body should be divided into two paragraphs . The first body paragraph can illustrate the figures having the same trend (increasing or decreasing) and the other will be the opposite (e.g. paragraph 1 – decreasing trend; paragraph 2 – increasing trend). The other way to divide the body is to base on the categories such as countries, genders, etc. In addition, you can split up the body according to the period of time (e.g. paragraph 1 – changes from 1995-2000; paragraph 2 – changes from 2000-2005)
Remember to describe figures in detail in this part, and each paragraph should include 3 to 4 sentences.
>>> Read more: IELTS Writing Task 1 Pie Chart .
3. Steps to effectively write an IELTS Writing Task 1 Line Graph essay

3.1. Step 1: Analyse the Line Graph IELTS Task 1 question
In the question given, there will have:
- A short description of the Line graph (e.g. The graph below shows radio and television audiences throughout the day in 1992.)
- Requirements: Summarise the information by selecting and reporting the main features, and make comparisons where relevant. & Write at least 150 words.
- The image of the Line Chart
It is highly recommended to highlight or underline key words in the Line graph question so that you can keep track more easily while writing.

3.2. Step 2: Spot main features of the Line graph
To help you with this step, these questions can be taken into consideration:
- What information do both x-axis and y-axis give?
- What is the time period?
- What is the general trend?
- What are the most noticeable features?
- Are there any similarities among categories?
- How to group the data? (for Body part)
Answering all the questions above will firmly give you a more specific view onto the Line graph essay.
3.3. Step 3: Write your IELTS Writing Task 1 Line Graph essay
It’s time to start off your writing. Remember to follow the structure:
- Paragraph 1: Introduction
- Paragraph 2: Overview
- Paragraph 3: 1st detailed features
- Paragraph 4: 2nd detailed features
3.4. Step 4: Double Check your IELTS Writing Task 1 Line Graph essay
Make sure your essay does not have any grammatical or spelling mistakes. Besides, using various structures will boost your final score.
4. Tips for IELTS Writing Task 1 Line Graph

- Use two different paragraphs for the Body
Try to divide the body part into 2 paragraphs because this can enhance the organisation of the report and make it easier to read.
- Compare the lines
Avoiding describing each line separately but comparing those in most of your sentences will gain you a better score.
- Don’t try to describe all the elements
Just focus on key and outstanding figures only since the time allowed is limited so you don’t have to list every detail in the Line graph.
- Start the report with the first year and finish with the last year
First of all, look at the x-axis and report the first year’s figures and compare lines in that year. Then finishing the report the last year given.
- Don’t express your feeling or perspective
IELTS Writing Task 1 Line Graph , and all other types of questions in IELTS Writing Task 1, will be a report of data and numbers, so don’t give any personal point of view in your essay.
- Use appropriate vocabulary and structures
IELTS Line Graph vocabulary and various grammar structures should be used properly. You can refer to this article ielts academic writing task 1 to learn more about vocabulary for IELTS Writing Task 1 Line Graph .
- Watch out the time and word limit
You should spend approximately 20 minutes for IELTS Writing Task 1 with at least 150 words, so make sure your essay will be eligible.
To dominate IELTS Writing Task 1 Line Graph , having a grasp of knowledge is not enough but you need to consult diverse samples and practice as much as you can. To do so, IELTS TEST PRO with both mobile app and website platforms can facilitate you with multiple model samples and practice tests to write under time pressure. Download IELTS TEST PRO mobile app or visit our website now!
- TOEFL Writing Correction Topics
- OET Course & Mock Test
- Writing Correction
- Speaking Mock Test
- Reading Course
- Listening Practice Tests
- FREE Practice Tests
- OET Writing Correction
- OET Reading Course
- OET Speaking Mock Test
- TOEFL Writing Correction
- PTE Writing Correction
- OET Listening Practice Tests
- OET (Occupational English Test)
- PTE (Pearson Test of English)
- Academic Task 1
IELTS Line Graph for Writing Task 1- Benchmark IELTS
- Task 1 Guide
- Table & Bar
- Bar & Pie
- Table & Pie
- Compare Contrast
- Identifying Trends

This guide covers important IELTS line graph examples including questions of IELTS Academic writing task 1 . Let’s start preparation with Benchmark IELTS!
Table of Contents
1.1 objective, 1.2 skills used.
- 1.1 Line Graph in the Past
- 1.2 Line Graph from Past to Predicted Future
3.1 Introduction
3.2 overview, 3.3 main body paragraphs.
- IELTS Writing Task 1 Band Descriptors Explained
5.1 Language to Describe Trends
- 5.2 Verbs and Adverbs to Describe Change
5.3 Adjectives and Nouns to Describe Change
5.4 linking words, 5.5 time expressions, 6.1 after + -ing + adverb, 6.2 having + past participle + adverb.
- 6.3 After which/ at which point
7.1 Sample Answer Commentary
- 8.1 Problem 1
- 8.2 Problem 2
- Quiz- Check Your Understanding
1. IELTS Line Graph Overview
Line graphs are a very common IELTS writing task 1 question type. You will be given a line graph (or sometimes two) with multiple lines that illustrate a change over time.
The line graph(s) will have two axes ; the X-axis (horizontal) will typically show the time period and the Y-axis (vertical) will show the measurement.
You should spend 20 minutes completing this task and write at least 150 words (aim for around 160-190) – you can read this guide on suggested Academic Writing Task 1 word length .
The main aim of this task is to produce a formal report that summarises and compares the main features of the IELTS line graph(s). Here are some examples of formal language you could use in your report:
You are being tested on your ability to select the key features from the graph and present the main trends in a summary in a formal report . You also need to compare the data when it’s appropriate.
2. IELTS Task 1 Line Graph Questions
You may be given one or two line graphs that illustrate changes in different categories over a period of time. The time period could occur in the past , or range from the past to the predicted future .
Here are some IELTS Line Graph examples:
2.1 Line Graph in the Past
The graph gives information about the visitors to Cardiff and Dublin from 2010 to 2020.
Summarise the information by selecting and reporting the main features and make comparisons where relevant.
Write a minimum of 150 words

IELTS External links
Also, read the following IELTS Report Writing Guides
- IELTS Bar Chart
- Line Graph IELTS
- Pie Chart for IELTS
- IELTS Academic Table
- IELTS Academic Process Diagram
- Maps for IELTS
- Combined - Table and Bar Chart
- Combined - Bar Chart and Pie Chart
- Combined - Table and Pie Chart
- IELTS Writing Task 1 Guide

2.2 Line Graph from the Past to Predicted Future
The graph gives information about the actual and predicted number of visitors to Cardiff and Dublin from 2018 to 2040.
Summarise the information by selecting and reporting the main features and make comparisons where relevant

3. Structure for Line Graph Task 1 Questions
When you are producing an IELTS writing task 1 report, you should always include:
- An introduction
- An overview
- Two main body paragraphs
The above IELTS report writing structure can be followed on other Academic Task 1 types including bar graph, process diagram, maps and pie chart .
Whether you are taking the paper or computer-based IELTS test, you should leave a line between each paragraph so it is clear for the examiner.
Read on for more detail on what to include in each paragraph…
Your introduction should always paraphrase the given statement. Paraphrasing is a key skill that is useful in all parts of the IELTS academic exam, especially writing. You are showing the examiner that you have understood the statement by putting it in your own words . This might be by using synonyms or what are sometimes called parallel expressions (phrases with the same meaning). You can also change the word order in the statement or the class of a word (e.g. change a verb to a noun).
You should not try to memorise an answer, but you can learn some useful expressions to start your introduction. Here are some you can use for line graphs:
- The graph shows information about …
The graph shows…
- The graph illustrates…
- The line graph compares…
- The line charts detail…
Look at the example paraphrased statement for a line graph:
Example of paraphrasing
Original statement: The graph gives information about visitors to Cardiff and Dublin from 2010 to 2020.
Paraphrased statement: The graph shows information about how many people visited Cardiff and Dublin over a ten-year period between 2010 and 2020.
Changes: The graph gives information about…
…visitors to Cardiff and Dublin…
…how many people visited Cardiff and Dublin…
from 2010 to 2020
over a ten-year period between 2010 and 2020
Your overview is probably the most important part of your IELTS writing task 1 report. In fact, without it you will struggle to score above a band score 5 in task achievement (see our section on IELTS Band Descriptors Explained for more details).
An overview should be one paragraph that summarises the key trends shown in the line graph(s). The key trends are the main increase and decreases in the graph, in other words, the most noticeable features . Do not go into too much detail by referring to specific figures, save the detail for your main body paragraphs.
The best way to start your overview paragraph is with ‘ Overall …’ as this clearly shows the examiner where to find your overview. You can also use phrases such as ‘ In summary …’ or ‘ to summarise ’.
You do not need to write a separate conclusion (you will need one for writing task 2).
Your body paragraphs should go into more detail about the key information in the line graph(s). You need to make your paragraphs clear and organise them logically. Here’s a possible example:
Main Body Paragraph 1 – Describe the changes in one category (e.g., travellers to Cardiff)
Main body paragraph 2 – Describe the changes in another category (e.g., travellers to Dublin) and make comparisons with the first category
The content of your body paragraphs will depend on the line graph(s) but here are some general points to consider :
- Be selective when choosing what lines to describe (you are being marked on your ability to report on the key features )
- Be accurate when you are reading and writing about the data
- Refer to any units given on the graph’s axes (such as %, £, $)
- Use a range of linking words , adjectives, adverbs , nouns and verbs (see Vocabulary for IELTS Line Graph )
- Use different time expressions to describe the passage of time
- Do not make spelling mistakes
- Use a range of vocabulary and grammatical structures to describe change (see Grammar for IELTS Writing Task 1 Line Graph )
4. IELTS Writing Task 1 Band Descriptors Explained
Here’s a link to our guide to IELTS Writing Band Descriptors with all you need to know about each section.
5. Vocabulary for IELTS Line Graph
A line graph will illustrate different trends that you need to describe. This could be an upward trend , a downward trend or other noticeable trends . Here are some useful nouns and verbs to help you describe each type:
5.2 Verbs and Adjectives to Describe Change
You can use a combination of a verb + adverb to describe the trends more accurately and avoid repetition.
Remember, if the data in your line graph occurred in the past, you will need to use the past simple form of the verb. If the data is from the present, you should use the present form of the verb
Here are some examples of verbs + adverbs to describes changes in a line graph:
These verbs do not require an adverb (their meaning already implies a big change):
You can also describe changes in a line graph using an adjective + noun phrase.
For example:
You should use linking words in Academic IELTS writing task 1 as they will help to organise your report and they will improve your score in Coherence and Cohesion . Here are some useful words to use in writing task 1:
- To begin with,…
- To start with,…
- And then,…
- At this point,…
- Subsequently,…
- After this,…
- Then,…
- Afterwards,…
- Finally,…
- …with the figure at _____
Writing about a line graph will require you to describe the passing of time. Here are some expressions to help you avoid repetition when talking about time:
6. Grammar for IELTS Writing Task 1 Line Graph
Using a range of grammatical structures will increase your score in Grammatical Range and Accuracy. Here are some example structures that you can use in your own writing:
Example: After falling considerably to 2.5 million in 2015, the numbers then rose dramatically to 5 million in 2020.
Example: Having fallen considerably to 2.5 million in 2015, the numbers then rose dramatically to 5 million in 2020.
6.3 After which/at which point
You can join two changes together by adding after which or which point and an additional clause.
Examples: The number of visitors to Cardiff dropped slightly to 1.5 million in 2015, after which point there was a sharp rise to 4 million in 2018.
The number of visitors to Dublin increased slightly to 6 million in 2015, at which point there was a considerable decrease to 4 million in 2018.
7. IELTS Writing Task 1 Line Graph Sample Answer
The graph shows information about how many people visited Cardiff and Dublin over a 10-year period between 2010 and 2020.
Overall , what stands out from the graph is that there was an upward trend in the number of visitors to Cardiff, but the number of visitors to Dublin saw a significant decrease over the period. A further additional point is that Dublin had more visitors in 2010, but in 2020, Cardiff was much more popular than Dublin.
In detail , the number of visitors to Cardiff started at around 1.5 million (m) in 2010 and then the figure rose steadily to about 2.3m in 2013. After that, the figure levelled off and stayed at 2.3m until 2014. Having fallen slightly to about 1.7m in 2017, the number of visitors then soared , rising sharply to just under 4m in 2018. Lastly , there was a gradual increase , with the final figure finishing at 5m in 2020.
However , if we look at the number of visitors to Dublin, the trend was very different. The number of visitors started at around 4.9 m in 2010, after which there was a considerable fall to approximately 2.3m in 2013. After a slight increase to 2.5m in 2015, the figure then declined steadily to just over 2m before finishing at 2m.
The report above would receive an estimated 9.0 overall in the IELTS writing task 1 Academic paper.
It has been organised into four logical paragraphs that are clearly divided into an introduction, overview, and two separate body paragraphs. The minimum 150 word count has been exceeded. The report is written in a formal style (the writer has not included their opinion and has not used informal language).
The overview paragraph has been clearly signposted using ‘overall’ and the introductory phrase ‘what stands out from the graph is that…’ The overview describes the main trends of the line graph and does not include any specific figures.
The dates of the graph have been referred to accurately and the past tense has been used throughout the report.
A range of past simple verb + adverb constructions have been used to describe changes in the data e.g., ‘rose steadily’. Other language to describe change has been used, such as ‘levelled off’, ‘rising sharply’, ‘gradual increase’, ‘considerable fall’ and ‘declined steadily ‘.
A range of grammatical constructions have been used, for example, ‘having fallen slightly’ (having + past participle) ‘…after which there was a considerable fall’ (after which/at which point).
8. Common Errors and How to Avoid Them
Problem 1 Trying to describe every detail of the line graph.
Solution 1 You need to demonstrate your ability to select the key features from the graph. You will not lose marks for leaving out any data points. You do not have the time to write about every feature in 20 minutes. Instead, focus your time and energy on the figures in the graph that are the highest, the lowest, and the most interesting figures.
Problem 2 Not referring to the figures when describing the data.
Solution 2 You should always refer to the figures (e.g., number of visitors) in your main body paragraphs. By doing this, you are fulfilling the Task Achievement criteria and demonstrating to the examiner that you have understood the graph. See the examples below:
Incorrect The number of visitors to Cardiff dropped slightly in 2015, after which point there was a sharp rise in 2018.
Correct The number of visitors to Cardiff dropped slightly to 1.5 million in 2015, after which point there was a sharp rise to 4 million in 2018.
9. Quiz- Check Your Understanding
Take this short quiz to test your understanding of writing task 1 and line graphs:
- Four Answer: C. Exp × You need to include an introduction, an overview, and two main body paragraphs.
Explanation: You may be given a line graph with data from the past, from the past to the future, or even two line graphs in one question.
Explanation: The diagram illustrates…’ is appropriate for a process diagram or map and not a line graph.
- The diagram illustrates…
Explanation: You should not describe every feature of the graph. Instead, you need to select, summarise and compare the key features of the graph.
- Verb + adverb
- Adjective + noun
- Having + past participle + adverb
Explanation: All of these structures will broaden your lexical and grammatical range when describing changes in IELTS line graphs.
Explanation: It is very important to refer to dates to make it clear which time period you are referring to throughout your report.
Explanation: You need to refer to specific figures to be accurate in your main body paragraphs. You should only avoid referring to specific figures in your overview.
- The number of visitors to Cardiff dropped slightly to 1.5 million in 2015, after which point there was a sharp rise to 4 million in 2018.
- The number of visitors to Cardiff dropped slightly to 1.5 million in 2015, there was a sharp rise to 4 million in 2018. Answer: A: This sentence uses the phrase ‘after which point’ to create order in the sentence.
- This number fell considerably to 2.5 million in 2015, the numbers then rose dramatically to 5 million in 2020.
A. uses the past simple form ‘fell considerably’
- Subsequently
B. is an example of verb + adverb, not a linking phrase.
- At this point
Leave a Reply Cancel reply
Your email address will not be published. Required fields are marked *

- ielts writing
- ielts listening
- ielts speaking
- ielts reading
- ielts practice test
- IELTS Sample Reports
- IELTS Sample Essays
- IELTS Sample Letters
- IELTS Vocabulary
Exam Updates & Tips!
Signup for preparation and special offers!
You have successfully joined our subscriber list.
Tips for IELTS Success

IELTS Writing Task 1 Line Graph: Types, Techniques and Sample Answers
IELTS writing task 1 line graphs are added in the test of IELTS writing task 1 academic to evaluate the understanding skills of a candidate. In this type of question, a graph is given by covering data with X axis and Y axis. You have to describe the information given in the line graph in 150 words minimum. You have to solve such task in 20 minutes.
Line graph types, procedure to write in line graph, strategies and skills required for line graph question type, sample answers, sample questions and tips are given below to make you familiar about IELTS academic writing task 1 line graph.
Line graph and its types
Line graph is also called a line chart in which you have to face a graph covering the data given in the graph represented by lines. There are two axis- X – axis and Y – axis. X – axis (horizontal) shows the time period while Y – axis (vertical) represents measurements. Line graphs represent the trends when data goes downward and upward.
There are three types of line graphs:
- Simple line graph:
This type of graph has one line plotted.
- Multiline graph or polyline graph
In these types of graphs, more than one lines are plotted. These graphs are mostly used for comparison between data.
- Compound line graph
It is different type of graph, the area between two lines is shaded, representing the filled area.
Different types of visual aids are there in IELTS writing task 1 academic. IELTS line graph is also one of the question types in IELTS writing task 1 academic. In line graph of IELTS writing task 1, you have to face a line graph containing information changing from one aspect to other. You have to solve this question type of IELTS writing to describe the data given in the test.
There are three different types of line graph – Simple line graph, multiline graph or compound graph, you can face in the test to solve. IELTS writing assessment criteria is important to learn for understanding marking criteria of writing test. A procedure to answer in IELTS line graph is broadly described in the article. Skills are necessary to solve this type of task. There is dedicated vocabulary for line graph of IELTS writing. Cohesive devices help to make your answer effective. Sample answers of IELTS writing task 1 familiarize you, how to answer in IELTS line graph questions. Question samples help you to practice in a better way.
Common errors regarding line graphs and tips for IELTS writing task 1-line graphs are essential to help you in line graph as well as for IELTS writing.
Procedure to write a line graph essay
A procedure to write an answer in line graph essay, first of all, you need to understand the graph and its trends. Note all key features and ups and downs very well. Write main trends in overview. The structure for IELTS writing task 1 line graph is simple as the introduction, overview, body paragraph 1 and body paragraph 2. In the body paragraphs, you have to add main features of the line graph.
There are five steps to answer in IELTS line graph:
- First of all, understand the line graph.
- Find out all main features and comparisons if valid.
- Introduce the task in which you have to paraphrase the question normally.
- Write overview in which you have to write the trends of the line graph.
- Writing the paragraphs in detail means to write all main features, key information and facts and figures discussed in these two body paragraphs.
Skills required for IELTS line graph
Multiple types of skills are evaluated by this type of task. The examiner evaluates you how you capture the graph and its main features, trends, comparable strategies and your writing style. Polish your writing skills to get high bands.
IELTS line graph vocabulary
It is also essential to learn vocabulary for IELTS line graph. IELTS line graph vocabulary is one of the important factors, very useful and helpful while writing the answer of IELTS line graph writing task 1. Some of the main words are given below to practice and write your answer in an effective manner.
Upward trend
Downward trend
Useful linking words in line graph answer
The usage of linking words is important to get good bands in coherence and cohesion and these linking words organize the structure of your answer well. The useful linking words are given below to adapt.
- To begin with, …
- To start with, …
- In case of, …
- And then, …
- At this point, …
- Subsequently, …
- To sum up all, …
- After this, …
- After towards, …
- In turning to, …
- In a nutshell, …
IELTS line graph sample answers

Sample answer:
The line graph shows three types of spreads (Margarine, low fat and reduced spreads and butter) which were consumed during 26 years from 1981 to 2007. The measurement quantity unit gram is used in the line graph.
Overall, the consumption of low fat and reduced fat increased during the period while butter and margarine spreads decreased in 26 years. In the starting of the time, butter was very famous but with the passage of time, it dropped. While in case of margarine, it was the second most popular and stable during the time period, but in final years it decreased from both margarine and low fat and reduced spreads. Low fat and reduced spreads rose from both of them in final years.
Turning to the quantity of spreads, butter began from 140 grams from initial years and peaked to 160 grams in 1986. After it, decreased and got the position at 50 grams in final years. 90 grams margarine was eaten, rose slight in the mid and decreased in final years nearly to 40 grams.
While the trend of low fat and reduced spreads started in mid of the years mean in 1996 and got highest position at 80 grams from both butter and margarine within the time duration of 5 years. It decreased slight and reached 70 grams in final years.
Words count: 222

The line graph depicts varying city population percentages in four Asian countries from the period of 1970 to 2020, with predictions for 2030 and 2040.
Overall, there is increase in the percentage of the population living in the cities of four Asian countries. This augmentation is predictable to be same or increase more in future. According to the line chart, Malaysia is one of the highest in the rate of population increasing countries in which people turn to live in city.
30 percent of the population lived in the cities, if we talk about Philippines and Malaysia. There is expected for Malaysia that city population will increase 80%. While Philippines is expected from 45 percent to 55 percent.
In order to talk about Thailand, there was 20 percent population in cities in 1970 and there is a guess to increase 30 percent in future. In case of Indonesia, city population was 15 percent and rose 50 percent in 2020, while expected to 60 percent in 2040.
Furthermore, predictions describe that there will be more growth in city population in coming years. In 2040, it is expected that Malaysia will be at top in city population nearly to 85 percent, Indonesia will be second near to 65 percent. While the figures for Philippines and Thailand will be near to each other predicated to 55 percent and 50 percent approximately.
Words count: 231

The line graph depicts the average cost that American customers spent on mobile and landline phone services during the period of 10 years.
Overall, the landline phone services were declined every year while in the case of mobile services, it grew every year. Both of the services reached at same point in 2006.
In 2001, spending on mobile phone services began near to 200 US dollars, while the amount for landlines phone annual expenditures was 700 US dollars. Within the duration of 5 years, expenditures for landlines services dropped and expenditures on mobile phone services rose to 500 US dollars.
In turning to the year 2006, both services mobile phone and landline services met at the same point expenditures that was about 550 US dollars. Later on, mobile phone services continued to rise and its expenditures reached at 750 US dollars in 2010. While in the case of landline phone services, the expenditures decreased regularly and in 2010, the expenditures were 450 US dollars.
Words count: 161

This line graph illustrates information about number of passengers using underground station in London around the clock of a day. According to the line graph, the busiest time at the ground station would be 8:00 AM to 6:00 PM.
A large number of passengers who traveled using the underground station were at morning, 8:00 am. This amount increased during first two hours from 6:00 am to 8:00 am, when around 400 number of people traveled by underground station. The number of people dropped to half, at 10:00 am. After it, passengers again rose between the duration of 11:00am to 3:00 pm where near to 300 people travelled using the underground station.
While in afternoon, trend went to downward where just 100 people used underground station to travel. In the evening, at 6 pm, a number of people increased near to 380. After 7:00 pm, the number of people dropped and varied for the last two hours from 8:00 pm to 10:00 pm.
Overall, the number of people increased in morning and early evening to use underground station for traveling.
Words count: 188

The line graph depicts the percentages of citizens who aged 65 or above in three various nations from 1940 to 2040.
Overall, the proportion of the people of aged 60 or above for America and Sweden increased with a slight difference whereas the proportion for Japan decreased first and started to increase in 1990 by slow speed. But in 2020, it increased by high level from both of the countries United States of America and Sweden.
Initially, the percentage of aged people in America was higher with the percentage of 9. The aged people of 65 or over of Sweden were highest in the percentage after America, 7 percent respectively. Japan was the country where the proportion for aged people was least from both of the countries America and Sweden. Just 5 percent of the aged people are there in the Japan. The increasing rate of aged people in America started after 1960 with just 1 percent increment before. The expected increasing proportion of aged people will be 23 percent in 2040 for America. While in the case of Sweden, the population of older people increased and there is expected to reach this percentage to 25 percent while in initial it was 7 percent.
Turing to Japan, the proportion of old people was 5 percent and it decreased with the passage of time while in 2030, the percentage for aged people would increase and it is estimated that it will reach at 27 percent. So, the highest percentage of aged people will lie in Japan.
Words count: 258

The line graph illustrates the changes in temperature of three cities (Paris, Dubai and Sidney) in different months of the year. Temperature is measured in temperature unit degree Celsius .
Overall, Paris is the coldest city instead of Dubai and Sydney, while Dubai is the hottest city. In case of Sydney, the temperature is opposite of Dubai and Sydney.
Turning to line graph, the temperature never goes above 20 degrees Celsius. While the temperature of Dubai never drops below 18 degrees Celsius. There are similarities between Dubai and Sydney, the temperature in March and December remains same between 23 and 24 degrees Celsius.
In the months of May and September, the temperature of Paris and Sydney remains similar near to 15 degrees Celsius. If we talk about the highest temperatures in Paris and Sydney, the highest temperature is 20 and 24 degrees Celsius respectively. In case of Dubai, the highest temperature lies at 36 degrees Celsius. The lowest temperature is in Paris instead of Dubai and Sydney.
Words count: 170
IELTS line graph sample questions to practice
IELTS writing task 1 line graph sample questions are there to practice and perform well in exams. These sample questions for IELTS writing task 1 are given below to solve. If you face any difficulties during practice, you can contact us by comment section or other social media sites that are provided in the end. I will try my best to solve your problems regarding IELTS writing task 1 line graph questions and overall IELTS.

Employment rates of men and women in three countries in Europe in 1991

Common errors in describing line graph
There are two common problems found in IELTS writing academic task 1. Therefore, practice best and avoid to do such types of mistakes:
- Most of the aspirants try to solve the line graph but they do not provide the required details of the graph.
- Aspirants do not focus on figure and they direct start to describe.
Tips for IELTS writing task 1 line graph
IELTS writing task 1 line graph tips are very helpful in your IELTS exams. These tips for IELTS writing line graph are mentioned below:
- Be focused on title of the line graph, because you have to write it in your overview.
- In the introduction, you can paraphrase the question of line graph asked in the test of IELTS writing task 1 as a question statement.
- You have to explain all features in your body paragraph 1 and 2.
- You are required to write sum up discussion in overview.
- Follow X-axis and Y-axis in the same way to describe the information given in the line graph.
- You have to practice different types of line graphs to get good bands.
- Build strong vocabulary for writing test, because you are not allowed to repeat same wording in your writing. Write wide range of words in your answer.
- Cohesive devices make your writing effective, so do not forget to use them.
In a nutshell
In IELTS writing task 1 line graph, you face a line graph in which specific type of data is provided. In line graph, the data or information vary from one aspect to other. In this type of task, you have to explain the information given in the line graph. The answer for IELTS line graph essay must contain all main features of the data given in IELTS writing task 1.
IELTS writing task 1 line graph sample answers are very helpful in the question types of IELTS writing task 1 line graph. Advance vocabulary, sample questions, common mistakes, skills, procedure to answer in line graph and tips to solve IELTS writing task 1 line graph are essential to perform excellent in IELTS writing.
Frequently asked questions (FAQs) about line graph
These are the graphs in which different types of changing information or data can be found. They have an x – axis and y – axis in the graph having information.
There are 6 types of charts/graphs in IELTS writing task 1 which are mentioned below:
- Process diagram
There are four components of an answer essay of line graph:
- Introduction
- Body paragraph 1
- Body paragraph 2
There are three different types of line graphs:
- Simple line graph : There is just one line plotted on graph.
- Multi-line graph : There are two or more lines in this type of graph.
- Compound line graph : In this type of graph there are multiple lines and having the area of shadow or shaded area.
You are not allowed to write conclusion in the line graph essay, you can write an overview.
Exactly, dedicated and advance vocabulary makes your writing effective.
You have to explain all features and main information included in the line graph. First, write an introduction to paraphrase the question, then write overview in which you have to paraphrase the title of the line graph and explain other details in body paragraph 1 for one aspect and body paragraph 2 for another aspect.
Similar Posts

IELTS Validity- a Detailed Overview
In this article, you will learn about What is the IELTS score validity? IELTS stands for International English Language Testing System. This test is designed…

How to Describe IELTS Writing Task 1 Pie Chart
IELTS writing task 1 pie chart is a round shape chart which is divided into different segments. Each segment contains specific information in the pie…
IELTS Writing Task 1 Bar Graph Sample Answers
In IELTS writing task 1, bar graph is also similar as line graph. The nature of content in bar chart looks like line graph. But,…

IELTS Pie Chart: Writing Task 1 Pie Chart Tips
IELTS pie chart is question types in IELTS writing module. In order to write an answer, it is helpful for you to have a good…

Reading: IELTS vs TOEFL
IELTS as well as TOEFL, both of these are the test of English language. The module of reading is one of the main modules in…

IELTS Academic Reading Passage 2
IELTS Academic Reading Passage 2: Visual Symbols and the Blind you should spend no more than 20 minutes on Questions 27-40 which are based on Reading…

How to Write A Task 1 Line Graph Band 9 Report

Line graph is a line that connects individual data points that show quantitative variations over time. This is a very common question type for IELTS Academic Writing Task 1.
On this page, you will find a complete discussion on IELTS Task 1 Line Graph question. The discussion will proceed under the following 7 major steps:
Analyse the question
Identify the major features
Remember the 4 paragraph structure
Paraphrase the question sentence
Write an Overview paragraph
Write the Body paragraph 1
Write the Body paragraph 2
Using the 7-step strategy in the IELTS Academic Writing Task 1 is a smart move that can greatly improve the standard of your IELTS writing.

However, if you want to ensure you get the band score you need, you may want to consider using our guaranteed Writing Feedback Service . Our team, made up of former IELTS examiners, will provide detailed feedback and step-by-step guidance to help you achieve your target score.
Additionally, we offer high-quality eBooks written by a team of former IELTS examiners, which provide powerful tips and strategies to help you achieve a band score of 7 and above. These eBooks are full of valuable insights and in-depth discussions covering all aspects of every possible IELTS essay type, and are an excellent resource for anyone looking to succeed in the IELTS exam.

You should spend about 20 minutes on this task.
The graph below shows the production levels of main fuels in a European country from 1981 to 2000. Measured in tones.
Write at least 150 words.

Source: Cambridge English IELTS Past Papers

1. How to Analyse A Task 1 Line Chart Question
To answer the question effectively, we should identify three key aspects:
Topic words or keywords: These are the main themes or subjects in the question that we need to focus on.
In this case, the topic words are related to the production levels of the primary fuels .
Micro keywords: These are specific terms or details that can help us prepare a precise answer. For this question, the micro keywords are petroleum, coal, and natural gas, as well as the time period of 1981 to 2000 .
Action words: These are the words that tell us what we need to do to answer the question. In this case, the action word is " compare ," which means we need to identify similarities and differences between the production levels of the three primary fuels.
Once we have identified these key aspects, we can then look for major features in the diagrams that will help us to answer the question. You can get more in-depth discussion on this part in the eBook .

2. How to Identify the Main Points in A Task 1 Line Chart
Finding the major features in an IELTS task-1 Line Chart question involves the following steps:
Identify the Variables: The first step is to identify what the line chart is measuring or comparing. These variables could be anything from economic data to demographic trends. The chart's title and the labels on the x and y axes will provide this information.
Look for Trends: Once you know what the chart is about, look for the most noticeable trends. These could be increases or decreases over time, periodic fluctuations, or any patterns that are repeated.
Note Key Changes: Apart from general trends, also note any key changes or turning points in the data. For example, if the line dramatically rises or falls at certain points, these would be significant features.
Compare Different Lines: If there are multiple lines on the chart, you'll also need to compare them. Look for any interesting similarities or differences. For instance, you might find that two lines follow the same pattern but at different scales, or that they move in opposite directions.
Consider Extremes: Look for the highest and lowest points on each line. These extremes often represent significant features of the data.
Don't Forget Timeframes: Pay attention to the period of time that the line chart covers. Major features could be related to specific years or periods.
Remember, the task is not to describe every detail, but to highlight and explain the major features. Always interpret the data in your own words, rather than simply repeating the information presented in the chart. Use appropriate vocabulary to describe trends and changes, and make sure your report is well-organized and clear.
Going through these steps, we can find the followings:
Petroleum production showed fluctuations but consistently remained the highest among the three primary fuels.
Coal production experienced a gradual decline over time.
Natural Gas production saw a sudden increase after a prolonged period of stagnation.
At the end of the time period, only Natural Gas production showed an upward trend, while the other two fuels showed a decline.
The units of measurement for production levels are in tonnes.

3. Task 1 Line Chart Report Writing Structure
IELTS Task 1 line chart writing template is pretty straight forward. You can complete the essay using only 10 sentences! Yes, it is that much simple! Take a look how we place the 10 sentences in our 4 paragraph report. However, if you want to learn how to write each paragraph most effectively, please check the eBook where you get step by step detailed demonstration covering all the possible types of task 1 questions.
1. Paraphrasing the Question Sentence
Paraphrase the question statement using just one or two sentences.
2. Overview Paragraph
Sentence 1: summary statement 1(preview of the essay without presenting data)
Sentence 2: summary statement 2 (more preview without presenting data)
3. Body Paragraph 1
Sentence 1: first major point
Sentence 2: second major point
Sentence 3: extension sentence 1 (compare/combine the major points stated above)
Sentence 4: extension sentence 2 (extension of the previous sentence, or adding an exceptional feature).
4. Body Paragraph 2
Sentence 1: exceptional feature
Sentence 2: extension of the exceptional feature
Sentence 3: final sentence (wrapping-up the whole essay, completely based on the discussion above, nothing new)
Let's develop the answer step by step applying the above-stated 4 paragraph essay structure.
Well before jumping on to the line graph report writing, let's share you a powerful platform.
You know when it comes to achieving success in IELTS Writing, it's not just about answering the question. You also need to have a strong grasp of proper structure, vocabulary, organization, and grammar to effectively convey your ideas. That's where our IELTS Essay Correction Service comes in - an incredible platform for any student looking to improve their IELTS writing skills and achieve a high score on the exam.
Through this service, you'll receive detailed feedback from a former IELTS examiner. With the examiner’s direct guidance, you'll be able to pinpoint areas for improvement and work on developing your writing skills to meet your target score. Plus, if you have any questions or concerns, our support team is available 24/7 via email and live chat to provide assistance whenever you need it.
Our tailored approach and expert feedback ensure that you'll be well-prepared to achieve a band score of 7 or higher on the IELTS exam with confidence. Don't wait - sign up for our IELTS Essay Correction Service today and take the guaranteed leap towards success.
4. Paraphrasing the Question Sentence
In the first paragraph of our IELTS Task 1 essay, we aim to rephrase the question statement accurately without altering its meaning. This process is known as paraphrasing, and it requires a solid understanding of the relevant techniques that we have discussed in detail in the eBooks .
Crafting this paragraph flawlessly showcases to the examiner that you understand the question thoroughly.
Let's look at the actual question statement that we are using on this page:
" The graph below shows the production levels of main fuels in a European country from 1981 to 2000. Measured in tonnes. "
We can paraphrase this statement as below:
"The diagram depicts the quantity of Petroleum, Coal, and Natural Gas produced in a country over two decades, from 1981 to 2000, measured in tonnes."
That's it, quite simple. Our first paragraph is complete, and you have already used 25 out of 150 words. Let's move to the next part of the essay, the Overview Paragraph.
5. Overview Paragraph
The second paragraph of our IELTS Writing Task 1 essay is known as the Overview, and it's the most crucial section. Without an Overview paragraph, you cannot score above band 5 in the IELTS Writing section. So, it's vital to give special attention to this part in the eBook .
An overview is a brief summary of the significant aspects that you'll discuss in the body paragraphs. It's not necessary to include any data in this section, just mention the obvious features you notice in the diagrams. The main objective of this paragraph is to give the readers a general idea about your essay.
Overview Paragraph Structure
Remember our Overview paragraph structure:
Sentence 1: summary statement 1(preview o f the essay without presenting data)
Let's form the paragraph:
Sentence 1(Summary Statement 1)
" Despite some fluctuations, Petroleum consistently maintained its position as the primary fuel produced throughout the given period, while Coal exhibited a gradual decrease. "
Sentence 2(Summary Statement 2)
"In contrast, Natural Gas underwent a notable upsurge following a prolonged period of stagnant production levels."
Complete Overview Paragraph
"Despite some fluctuations, Petroleum consistently maintained its position as the primary fuel produced throughout the given period, while Coal exhibited a gradual decrease. In contrast, Natural Gas underwent a notable upsurge following a prolonged period of stagnant production levels."
Excellent, we've made good progress on our line graph Task 1 report. After paraphrasing the question in the first paragraph with 25 words, we've added 36 more words for the overview paragraph, completing two of our recommended four paragraph report. As a result, we're now halfway done and ready to tackle the first and second body paragraphs.
6. Body Paragraph 1
In the overview paragraph, we have given just a general statement of significant features, we haven't discussed any detail. Now it's time to explain them in the body paragraphs.
Body Paragraph 1 Structure
Remember our body paragraph 1 structure:
Sentence 1 : f irst major point
Sentence 2 : s econd major point
Sentence 3 : extension sentence 1 (compare/combine the major points stated above)
Sentence 4 : extension sentence 2 (extension of the previous sentence, or adding an exceptional feature).
Let's form the paragraph following the above-stated structure:
Sentence 1( First Major Point )
"Petroleum has consistently been the largest fuel source, despite fluctuations in its production levels."
Sentence 2( Second Major Point )
"In 1981, coal was the second-largest fuel production, with an annual output of 80 million tonnes."
Sentence 3( Extension Sentence 1 )
"Over time, however, coal's production levels have witnessed a gradual decline, while petroleum's production levels have remained variable between 100 and 120 million tonnes."
Sentence 4( Extension Sentence 2 )
"Eventually, by 2000, coal's production had reached its lowest point among the three major fuels."
Complete Body Paragraph 1
"Petroleum has consistently been the largest fuel source, despite fluctuations in its production levels. In 1981, coal was the second-largest fuel production, with an annual output of 80 million tonnes. Over time, however, coal's production levels have witnessed a gradual decline, while petroleum's production levels have remained variable between 100 and 120 million tonnes. Eventually, by 2000, coal's production had reached its lowest point among the three major fuels."
We're making great progress on our IELTS Task 1 essay, with 69 additional words added to the first body paragraph, bringing us to 75% completion. It's simple – we're just describing the main features we see in the diagrams.
So far, we've used 130 words out of the total 150 for our IELTS Task 1 essay. We just need to write at least 20 more words and one more paragraph to finish. That's awesome! Let's move on to the final paragraph, Body Paragraph 2.
7. Body Paragraph 2
The second body paragraph is the last one for our IELTS Task 1 essay and happens to be the easiest. It involves briefly stating other features in the first sentence, adding an overall comparison statement in the second sentence, and concluding with a final sentence summarizing the entire essay. We'll apply this structure to our second body paragraph.
Body Paragraph 2 Stru cture
Sentence 2: extens ion of the exceptional feature
Sentence 1(Exceptional Feature)
"While coal production witnessed a steady decline, natural gas production never decreased throughout the entire period, despite starting in the third position in 1981 and maintaining a long stagnant production level."
Sentence 2(Extension of the Exceptional Feature)
"By surpassing coal at 50 million tonnes, natural gas experienced a sharp increase, ultimately becoming the only rising fuel by the end of the period."
Sentence 3(Final Sentence)
"Therefore, as for petroleum, it remained at the highest level of production without any significant fluctuations, and natural gas was the only fuel that demonstrated a positive trend over the entire period."
Complete Body Paragraph 2
"While coal production witnessed a steady decline, natural gas production never decreased throughout the entire period, despite starting in the third position in 1981 and maintaining a long stagnant production level. By surpassing coal at 50 million tonnes, natural gas experienced a sharp increase, ultimately becoming the only rising fuel by the end of the period. Therefore, as for petroleum, it remained at the highest level of production without any significant fluctuations, and natural gas was the only fuel that demonstrated a positive trend over the entire period."
We've added 58 more words to the previous 130, and just finished the final part of our 4 paragraph essay. That means we have completed an IELTS Task 1 essay with 188 words, which is absolutely okay. In fact, you should write somewhere between 170 and 220 words to give a smart description.
To summarise, mastering the art of crafting a high band task 1 line graph report is a strategic process that requires close attention to details, accurate data interpretation, and skilful writing. By incorporating descriptive language for line graph trends, linking words for data comparison, and accurately representing and interpreting data, you will significantly boost your chances of scoring high bands.
Remember, consistent practice, utilizing sample IELTS task 1 line graph questions, and critical feedback are your ultimate keys to success. With patience and persistence, you will see noticeable improvement in your line graph report writing skills, thereby setting a foundation for a high band score in IELTS academic writing.
Don't forget to check the following resources:
Download IELTS High Scoring eBooks
Get Detailed Essay Feedback from An Examiner
Check the detailed discussion on all the question types
Multiple Graphs Bar Chart
Pie Chart Map
Table Chart Process Diagram
Press ESC to close

IELTS Writing Task 1 Line Graph: Follow the Trends to Boost Your Vocabulary
Line graphs are used to depict the information or the evidence which change in time. They are depicted using a cartesian plane having an x-axis and y-axis. Usually, the x-axis depicts the time period and the y-axis depicts what is being estimated. They are used for plotting data that have many changes and variations, which helps to highlight trends.
This article will help you to boost your vocabulary for the IELTS writing task 1 line graph and also to understand how to solve the task graph.
Also Read: IELTS Writing Task 1 Line Graph Examples: Here’s a Guide to Master the IELTS Essays
Tips to Get the IELTS Writing Task 1 Line Graph Proper
# Use correct synonyms in your writing.
# Use a spread of vocabulary.
# Do not repeat words and phrases from the examination question unless there’s no difference.
# Use some less common vocabulary.
# Do not use a similar word over once/ twice.
# Use precise and correct words during a sentence.
# For one graph use ‘s’ once the verb, like – furnishes data on, shows/ presents etc. However, if there are numerous graphs, don’t use ‘s’ once the verb.
# If there are numerous graphs and every one illustrates a distinct style of information, you’ll write that graph presents what style of information and use ‘while’ to point out an affiliation. Example – ‘The provided graph shows the number spent on nourishment in 2009 within Britain whereas the diagram illustrates a comparison of people’s ages United Nations agency spent additional on nourishment.
# Your beginning ought to be quite amazing because it makes the primary opinion of the examiner. It either makes or breaks your overall total.

Vocabulary for IELTS Writing Task 1 Line Graph
Here is some guidance to help you use the right vocabulary in your upcoming IELTS writing task 1.
Adverbs and Adjectives for Line Graph
Up verbs for line graph , down verbs for line graph .
Also Read: IELTS Writing Task 1 Line Graph Questions: Guide to Write Report of Line Graph
Guide to Task 1 Line Graph
Writing task 1 of the IELTS requires you to jot down an outline of a minimum of a hundred and fifty words in answer to a particular graph (bar, line or pie graph), table, chart, or method (how one thing works, however one thing is done). This task exercises your proficiency to pick out and note the most choices, to elucidate and compare knowledge, organize importance and trends in detailed info, or interpret a technique.
Guide to Boost Your Vocabulary
Also Read: How Much Time is Required to Prepare for IELTS? Here’s a Guide for IELTS Test Preparation
Quick Tips for IELTS Line Graph
#Paraphrasing the problem or topic within the introductory/ 1st paragraph.
#Explaining the most characters within the graph whereas illustrating the trend.
#Each paragraph ought to have associated acceptable illustrations with numbers and percentages to support the statement created within the passage concerning the information.
#Using the favourable synchronic linguistics type. The exploitation of the appropriate verbs, nouns, adverbs, adjectives, prepositions within the right places to stress the purpose.
#Look into numerous articles with graphs to know however an honest article is written and to understand the words employed in completely different variants of articles.
#Practice writing answers to complete several line graph-based inquiries to have a transparent underneath standing and be able to complete the solution in under twenty minutes.
Also Read: IELTS Writing Task 1 Academic Topics 2021: A Complete Guide to Writing Preparation
IELTS Line Graph Sample Answer
Here is a sample with answer
One should spend, 20 minutes on this category.
This is a line graph which shows the automobiles robberies per thousand which shows the four countries’ statistics between 1990 to 1999.
List the information by determining and documenting the initial details. Make sure you do comparisons and differences where they are relevant.
The line graph compares the number of cars taken for each one thousand vehicles in four countries from 1990 to 1999. Overall, it is frequently seen that automobile thefts were much higher in nice Britain than within the alternative 3 counties throughout the total time frame.
To begin, automobile thefts in Sweden, France and North American nations followed a reasonably similar pattern over the primary 5 years, all lasting at between five and ten per thousand. The overall trend tho’ for France and North American nations was a decrease within the variety of vehicles taken over the amount, with each at around half-dozen in 1999. In distinction, Sweden practised an upward trend, beginning the amount at more or less eight, and completing at scarcely below fifteen.
Interestingly, automobile thievery in nice Britain started at eighteen per thousand, which so much exceeded that of the opposite countries. It then fluctuated over the next 9 years, reaching a peak of twenty thieveries per one thousand in 1996, and ending the proportion slightly less than wherever it began, at more or less seventeen per thousand.
Hopefully, this article has provided you with the right information and one has to realise that it is important and crucial to study and prepare for the IELTS line graph task and also one needs the right preparation with the right focus and perseverance. So what are you waiting for, read the full article, follow the steps and prepare hard for IELTS
Also, for additional such knowledge, don’t miss to study our alternative blogs and if you’ve got any questions in mind, simply be comfortable to comment down below and let us grasp all concerning it in order that we will boost you thereupon within the chance as a result of we’ll be quite glad to encourage you out through it. IELTS Ninja is the best private online coaching that will enable you to clear your exam with full support and the right preparation.
Also Read: IELTS Writing Task 1 Academic Topics 2021: Get Yourself into Practice Mode

One Comment

Thank you for providing such a helpful blog, it was very well explained and it was useful to boost the band score too, what do you guys think about it?
Leave a Reply Cancel reply

Share Article:
About the Author
Amiksha kantam.
Amiksha is a budding Content Writer. A young writer who has written over 250 poems and quotes and also an author of a famous Wattpad novel named “Ma and the Magical Kingdom” and always sets her goals high with her determination like the sky. Her mother is her inspiration and her family is her biggest support. She has her interest in writing, reading novels and craft. She has developed her hardworking and disciplined persona from her mother. She is very out going and loves travelling, trekking and hiking. She believes in the quote “Creativity lies in actions not experience
You might also like

Describe Something Important that has been Kept in Your Family: A Cue Card Sample Topic for IELTS Speaking

How to Use an IELTS Calculator? Calculate Your Overall IELTS Exam Score

What is a Good IELTS Score? Is 7.5 a Good IELTS Score? Here’s All You Need to Know
Other stories, glass capturing the dance of light: different ielts reading answers, air traffic control in the usa: ielts reading answers and exam preparation.
- A Beginner’s Guide to IELTS
- Common Grammar Mistakes [for IELTS Writing Candidates]
Writing Correction Service
- Free IELTS Resources
- Practice Speaking Test
Select Page
How to Describe Line Graphs for IELTS Writing Task 1
Posted by David S. Wills | Sep 28, 2016 | IELTS Tips , Writing | 2

The IELTS Writing Task 1 often features a line graph. Describing a line graph is not as difficult as it seems. In fact, there are a few things to remember to help you gain a band 7.0 score.
You can learn these two structures and, with only a little bit of variation, you can describe almost any trend.
Interest rates decreased significantly.
Subject (what you’re describing) + verb + adverb
There was a significant decrease in interest rates.
There was + adjective + noun + (what you’re describing)
You can use these formulas to describe most trends in line graphs. Here are some more examples.
Unemployment levels dropped slightly.
The price of gas increased suddenly.
There was a steady decline in attendance.
As you can see above, you can use verbs or nouns to describe changes given that you alter the grammar of the sentence. This is useful for avoiding repetition. For example, read the following passage:
Interest rates increased from 5% to 6% and then increased again from 6% to 8%. They decreased to 4% and then increased once more to 7.5% before decreasing back to 5%.
It sounds awfully repetitive! Let’s trying mixing it up:
Interest rates increased from 5% to 6% and then rose again from 6% to 8%. They fell to 4% and then there was an increase once more to 7.5% before dropping back to 5%.
Here are some comparable pairs:
Keep in mind that if you use the verb + to then you must follow with a number. Also, most of those words can be used interchangeably, except for “boom” which suggests a large, sudden increase.
Being Specific
There’s a big difference between the right word and the nearly right word… In the IELTS, getting a higher band can be achieved by using more specific and accurate language . Instead of simply saying that something went up or went down, try using adverbs and adjectives to say how it went up or down.
Here’s a list of some useful words:
They can be used together thusly:

More Information About Line Graphs
If you want to see how you can use the above language in a report on line graphs, you should take a look at this helpful YouTube video:
If you need help describing line graphs, check out our writing correction service .
About The Author

David S. Wills
David S. Wills is the author of Scientologist! William S. Burroughs and the 'Weird Cult' and the founder/editor of Beatdom literary journal. He lives and works in rural Cambodia and loves to travel. He has worked as an IELTS tutor since 2010, has completed both TEFL and CELTA courses, and has a certificate from Cambridge for Teaching Writing. David has worked in many different countries, and for several years designed a writing course for the University of Worcester. In 2018, he wrote the popular IELTS handbook, Grammar for IELTS Writing and he has since written two other books about IELTS. His other IELTS website is called IELTS Teaching.
Related Posts

IELTS is Unfair!
May 17, 2019

IELTS Speaking Questions: Health
June 2, 2017

How to Easily Double Your Task 1 Vocabulary
May 17, 2017

Why Is My IELTS Writing Score So Low?
December 18, 2018

Hi David. Is it better to use past tense in the summary sentence in the last video? Thanks!
Either is possible here. Because I introduced the line graph as a line graph rather than referring to the data it represents, I felt the consistency in tense was important. However, from the perspective of the data, the past simple would be correct.
Leave a reply Cancel reply
Your email address will not be published. Required fields are marked *
This site uses Akismet to reduce spam. Learn how your comment data is processed .
Download my IELTS Books

Recent Posts
- Past Simple vs Past Perfect
- Complex Sentences
- How to Score Band 9 [Video Lesson]
- Taxing Fast Food: Model IELTS Essay
- Airport Vocabulary

Recent Comments
- Daisey Lachut on IELTS Discussion Essays [Discuss Both Views/Sides]
- David S. Wills on Describe a Historical Period
- Siavash on Describe a Historical Period
- fabliha on IELTS Speaking Partners
- tufail khan on IELTS Discussion Essays [Discuss Both Views/Sides]
- Lesson Plans
- Model Essays
- TED Video Lessons
- Weekly Roundup
Tip (2) Academic Writting Task 1 Tips for Line Graph
Tips for Line graph
Line graphs always show changes over time. Here’s some advice about how to describe them:
- Try to write 4 paragraphs – introduction, summary of main points, 2 detail paragraphs.
- For your summary paragraph, look at the “big picture” – what changes happened to all of the lines from the beginning to the end of the period shown (i.e. from the first year to the last). Is there a trend that all of the lines follow (e.g. an overall increase)?
- You don’t need to give numbers in your summary paragraph. Numbers are specific details. Just mention general things like ‘overall change’, ‘highest’ and ‘lowest’, without giving specific figures.
- Never describe each line separately. The examiner wants to see comparisons.
- If the graph shows years, you won’t have time to mention all of them. The key years to describe are the first year and the last year. You should also mention any ‘special’ years (e.g. a peak or a significant rise/fall).
- Start describing details (paragraph 3) with a comparison of the lines for the first year shown on the graph (e.g. in 1990, the number of…).
- Use the past simple (increased, fell) for past years, and ‘will’ or ‘is expected/predicted to’ for future years.
- Don’t use the passive (e.g. the number was increased), continuous (e.g. the number was increasing), or perfect tenses (e.g. the number has increased).
Follow Us On IELTSFever Facebook Page For More Updates
- Click to share on WhatsApp (Opens in new window)
- Click to share on Pinterest (Opens in new window)
- Click to share on Facebook (Opens in new window)
- Click to share on Tumblr (Opens in new window)
- Click to email a link to a friend (Opens in new window)
- Click to share on LinkedIn (Opens in new window)
- Click to share on Twitter (Opens in new window)
- Click to share on Reddit (Opens in new window)
- Click to share on Telegram (Opens in new window)
- Click to share on Pocket (Opens in new window)
- Click to print (Opens in new window)
About The Author

IELTS FEVER
2 thoughts on “tip (2) academic writting task 1 tips for line graph”.

Your posts are the best, but is it possible to send me weekly exercises through my email .

contact +919914301883 for daily tasks
Leave a Comment Cancel Reply
Your email address will not be published. Required fields are marked *
Notify me of follow-up comments by email.
Notify me of new posts by email.
- IELTS Scores
- Life Skills Test
- Find a Test Centre
- Alternatives to IELTS
- Find Student Housing
- General Training
- Academic Word List
- Topic Vocabulary
- Collocation
- Phrasal Verbs
- Writing eBooks
- Reading eBook
- All eBooks & Courses
- Task 1 Lessons & Tips
- Line Graph Structure
IELTS Task 1 Line Graph Structure
In this lesson we'll look at an IELTS task 1 line graph in order to help you understand how to deal with 'age groups' and to show you how it is possible to organise an answer in different ways.
There is usually more than one way to write about a graph. Each person may view it in a different way and decide on a different way to present the information.
One way is not necessarily better than another. However, if one way is difficult to follow, then this is obviously not the best choice.
What is important when you plan a task one is to think about how you can organize your graph in the most logical and clear way .
This often means grouping the information in some way, and you can do this by looking for patterns - look for similarities and diffferences.
Examples of Organisation
This sample IELTS task 1 line graph is divided up into age groups .
Although a graph like this is not over time as such, it can still be viewed in this way as it is showing how something changes over different ages - in this case, how certain factors in a neighbourhood when choosing a new home vary over age.
Take a look at the following question, the IELTS task 1 line graph below, and the model answers.
You should spend about 20 minutes on this task.
The line graph shows the percentage of people of different age groups and how they rate a set of factors in terms of importance when buying a new home.
Summarise the information by selecting and reporting the main features and make comparisons where relevant.
Write at least 150 words.
Organising by Factors
Percentage of people rating certain factors as important when buying a new home

Model Answer:
The line graph illustrates the importance, measured in percentages, that four ages groups place on five different factors when they move to a new home. It is immediately apparent that a low crime rate is the most important variable across all the age groups.
Of all the factors, the desire for a low crime rate is by far the most important. Amongst the all the age groups this figure stands at around 80%, with the middle aged and elderly viewing it as slightly more important. Next, schools are seen as very important by a significant proportion of 25 to 44 year olds although the percentages drop markedly as people get older, with just under 25% of 55 to 64 year olds viewing this as important.
Shopping facilities, being chosen by around 13%, are not viewed with such importance as schools and crime by the younger age groups. However, as people get older, this increases in importance to approximately 30%, and, as would be expected, is actually more important than schools to those over 55. Finally, although increasing in importance with age, neither parks nor public transport are viewed to be as important as the other factors by any of the groups.
As you can see in this answer to the IELTS task 1 line graph, the candidate has organized the answer mainly around the 'factors '.
Each one is described in turn, starting with the most important, low crime . Less is said about those that are not viewed as so important ( parks and public transport ).
Notice that the graph does not talk about each factor in isolation, but makes comparisons across the factors and groups. For example:
Of all the factors, the desire for a low crime rate is by far the most important .
Shopping facilities are not viewed with such importance as schools and crime by the younger age groups.
With an IELTS task 1 line graph you should always avoid simply discussing each point on a graph with no reference of how it relates to the other points.
Organising by Age Groups
The factors that are very important when purchasing a new house are very similar for the first two age groups. A low crime rate represents the greatest percentage of these groups at around 80%, though it is slightly higher for those aged 35 to 44. Schools as a factor is again very similar at around 60% for the younger age group, but dropping to around 45-50% for 35 to 44 year olds. A much lower percentage rate shopping, parks and public transport as important.
Turning to those aged over 45, low crime accounts for the largest proportion at approximately 80%, similar to those of a younger age. In contrast to the younger groups though, schooling was far less important, falling to below 25% for those aged over 55. This older group rate them as less important than shopping facilities. In fact, shopping facilities, parks and public transport all become more important factors as people get older.
This IELTS task 1 line graph has been organized primarily around the age groups .
The candidate has decided that the first two age groups are fairly similar and so can be grouped together, and the second two age group have similarities.
The differences between the under 44s and over 44s have also been highlighted. For example:
Turning to those aged over 45, low crime accounts for the largest proportion at approximately 80%, similar to those of a younger age.
This lesson has been about how to write about age groups and examples of how answers may be organized differently.
Although this was about an IELTS task 1 line graph, it applies to any graphs or charts in task 1, such as bar graphs or pie charts.
You need to make sure that you spend a few minutes analyzing the graph and deciding on the best way to organise it so it will be easy to follow when the examiner reads it.
More Task 1 Academic Lessons:

Describing Graph Trends Using the Language of Change
Describing graph trends: In IELTS you must know how to describe the trends that you see in the graph you are given. This lesson provides practice with some common language used to describe trends.

IELTS Table: Tips and techniques for a high score.
IELTS Table advice for a high score. Learn how to describe an IELTS table, which is just another way to present data.

Describing an IELTS task 1 graph over time
This lesson shows you how to write an IELTS task 1 graph or chart that is over time.

Tips for Organising an IELTS Line Graph
Organising an IELTS Line Graph - This lesson shows you have to improve the coherency of your graph in order to achieve a high band score.

IELTS Pie Chart Strategies and Tips for a Band 7, 8 or 9
This IELTS pie chart lesson provides you with tips and advice on how to describe an IELTS Pie Chart in order to get a Band 7, 8 or 9.

IELTS Line Graph Examples for Academic Task 1: Vehicle Thefts per 1000
IELTS Line Graph Examples - view sample graphs to help you prepare for the IELTS Test. This graph compares car theft. There is a question with a model answer.

Describing IELTS Graphs: Tips to avoid a common mistake
IELTS Graphs: A common mistake In IELTS graphs is to get the subject of the graph wrong. This lesson explains how this mistake is made and show you what you need to do to avoid it. There is a also a practice exercise.

IELTS Process Diagram Strategies and Tips
IELTS Process Diagram: In task 1 of IELTS writing you usually have to describe some kind of graph or chart. But sometimes you get a process. It is therefore crucial that you know how to do this. This easy to follow lesson explains how.

Line Graph Quiz
Line Graph Quiz: Have a go at this fun quiz to help you find out what you know about graphs and to help you improve your IELTS score.

IELTS Line Graph Sample Answer: Average carbon dioxide (Co2) emissions
View an IELTS line graph sample answer that would score highly in the exam. It's well organised and covers all the requirements of the task.

IELTS Bar and Line Graph: How to describe two graphs together
This Bar and Line Graph example shows you how you can write about two charts together in the IELTS test for task 1, with strategies and techniques.
Prepositions in Graphs Quiz: Between; from; to; at; of; in; with; by
Prepositions in Graphs: Practice using prepositions in the IELTS test. View a model answer and practice using a gap fill.

Writing Tips for a Graph in the Future in IELTS Academic
Graph in the future: Sometimes graphs in IELTS refer to a future time. You must know the language to write about these. In this lesson, learn how to write about an IELTS graph in the future. Getting the tenses right is an important part of the IELTS writing task 1.

IELTS Line Graph Worksheet: Practice the language of change
IELTS Line Graph Worksheet - this is a gap fill to help you practice the language of change for IELTS graphs over time.
Take an IELTS Quiz to test your IELTS knowledge
IELTS Quizzes to test and train you on the writing task and task 2 of the IELTS test. Gap fills and multiple choice.
How to Describe an IELTS Academic Writing Task 1 Graph
IELTS Academic Writing Task 1: This lesson describes in a simple way how you should describe a graph for the academic part of the test for task 1. You need an introduction, overview and body paragraphs. These simple steps will show you how, and how to get a high score.

Learn Compare and Contrast Language for IELTS Graphs
Compare and Contrast Language: In the academic IELTS task 1, you have to know the right language if you want to get a band 7 or higher. Practice your IELTS language for bar charts in this task 1 writing lesson.

IELTS Sample Line Graph
This is an IELTS Sample Line Graph with model answer that you can use to help you prepare to write your answer for a task 1 that describes changes over time.
Which Tenses for IELTS are the Most Important?
Candidates often ask which tenses for IELTS are needed in order to do well in the exam. This lesson goes through the grammar tenses and how they apply to the test.
Any comments or questions about this page or about IELTS? Post them here. Your email will not be published or shared.
Before you go...
Check out the ielts buddy band 7+ ebooks & courses.

Would you prefer to share this page with others by linking to it?
- Click on the HTML link code below.
- Copy and paste it, adding a note of your own, into your blog, a Web page, forums, a blog comment, your Facebook account, or anywhere that someone would find this page valuable.
Band 7+ eBooks
"I think these eBooks are FANTASTIC!!! I know that's not academic language, but it's the truth!"
Linda, from Italy, Scored Band 7.5

IELTS Modules:
Other resources:.
- All Lessons
- Band Score Calculator
- Writing Feedback
- Speaking Feedback
- Teacher Resources
- Free Downloads
- Recent Essay Exam Questions
- Books for IELTS Prep
- Student Housing
- Useful Links

Recent Articles
Alternatives to the IELTS Exam
Mar 22, 24 12:32 PM
Common Questions about the IELTS Speaking Test
Mar 09, 24 05:28 AM
IELTS Computer Delivered Practice Tests Plus Band Score
Mar 01, 24 02:38 AM

Important pages
IELTS Writing IELTS Speaking IELTS Listening IELTS Reading All Lessons Vocabulary Academic Task 1 Academic Task 2 Practice Tests
Connect with us
Copyright © 2022- IELTSbuddy All Rights Reserved
IELTS is a registered trademark of University of Cambridge, the British Council, and IDP Education Australia. This site and its owners are not affiliated, approved or endorsed by the University of Cambridge ESOL, the British Council, and IDP Education Australia.
You need to be logged in to view this member page.
Please log in or sign up .
This website uses cookies.
IELTS Preparation with Liz: Free IELTS Tips and Lessons, 2024

- Test Information FAQ
- Band Scores
- IELTS Candidate Success Tips
- Computer IELTS: Pros & Cons
- How to Prepare
- Useful Links & Resources
- Recommended Books
- Writing Task 1
- Writing Task 2
- Speaking Part 1 Topics
- Speaking Part 2 Topics
- Speaking Part 3 Topics
- 100 Essay Questions
- On The Day Tips
- Top Results
- Advanced IELTS
IELTS Writing Task 1: Line graph 4 main sentences
Learn how to make 4 different complex sentences for a line graph report. It is important to show the examiner that you can make a range of complex sentence structures.
It’s not difficult. You can easily improve your range of complex sentences.
Hello in this lesson I’m going to show you how to write
different complex sentences for
a line graph report in IELTS writing task 1
it’s very important when you write
your body paragraphs for your
IELTS task 1 that you have a range
of different complex sentences to show the examiner
now in a previous lesson
I showed you how to write a sentence
similar to this if you haven’t watched that
lesson please watch it is very important that you understand how to make
the sentence so what I’m going to do is I’m gonna take this sentence
the same information and change
the order so that we have different structures
let’s have a look at the sentence first
the number of people becoming a vegetarian
that is our subject it’s quite long
after the subject we’ve got the verb
and if you look at the dates you can see that it is
the past tense after the verb we need to
described the movement and that
is we say its increased steadily
so that’s our adverb after that
we had the numbers and after the numbers
we had that date so let’s
change that a little bit and write the sentence in a different way
well one way we could change as we could start with the dates
so between 2004
we say becoming vegetarian increased
steadily from
to 200 I’ll stop there often when we put the date first
we have a comma after that
and then we have the number of people
so that’s one way to change it now
there are more ways let’s have a look at another way
the next way I’m gonna show you to change that
is can you see this word here increased
now that’s a verb but
we could also use it as a noun an
increase so I’m gonna write a sentence using
this word as a noun to do that we need to start with
there was an increase
okay we always start with there was if it past tense of course
so there was and lets
stop for a minute because here we’ve got
the word steadily which is an adverb
now we still want to use that word
but because this will be a noun we need to use this
as an adjective so
if we have an adjective it usually comes
before the noun so that means we need to change the order
and the form of the word so there was
increase so
again very important remember if it’s a verb you have the adverb
afterwards if it’s a noun
you have adjective in front and we change from steadily
to steady so there was a steady increase
now we need to give this information
but to do that we need to use a preposition first
and the preposition is
in so there was
a steady increase in the number
we could say becoming vegetarian
if we want to develop that so we’ve got that
now we need the numbers
from about 75
to 200 and what’s missing
well the dates are missing
got between 2004
so that is another way to structure
your sentence and still give
all the information we need with the numbers
and the dates now there;s one more way
that I’d like to show you so let’s have a look
so the last way I’m gonna show you in this lesson
is again to use this as
an noun but we changed the sentence structure
again so the number of
people becoming
experienced a steady
so with this sentence we’ve got the verb experienced
the number experience the figure experienced
we could also say witnessed after the
verb we’ve got the noun a steady
adjective a steady increase
and we got a steady increase
between 2004
so now we’ve added the numbers
and the dates well those are the 4
main complex sentences you can use
when you write your line graph report for IELTS
writing task 1 there are other sentences we can use but they are the
main ones that you need to practice and
perfect which means write without
too many mistakes remember the more mistakes you make
lower your band score will be
so please practice writing those sentence structures
well that’s all for this lesson I hope that was useful for you
please remember to press like or share it with your friends
if it was useful well I’ll see you again
in another IELTS lesson
Hi Liz, I don’t want to ask anything regarding this. I just want to know are you all right? You haven’t posted a video for about 8/9 years. I’m really concerned about you. I’ve heard you are sick. Can you reply me? I’m asking this, because you are the reason why many of us passed their IELTS and settled in a good country!
Thanks for your message. I’m still sick. It’s a long-term illness. However, this year I am a bit stronger than I have been in the last 8 years. I’m planning to return to making videos but I can’t do it quickly and have to be very careful. Each year I need to see what happens and make decisions based on my situation. I really appreciate your support 🙂
Take care, Liz. The health is first! Wish you all the best! And thank you for all what you`re doing!
Liz, i want to appreciate all of your doings, but i didnt know that you have a sickness. Wish you to get rid of it asap and hopefully hear these kind of thankful comments more than you have ever had. Actually, im having an exam on the 24th of February and ive been preparing for this gradually with your labour. I guess ive gained much enough knowledge to become a sevener 🙂 and its all thanks to you. Thank you very much, Liz. We all love you!! All the best!!
Thank you for your very kind comment. I appreciate your support. I wish you luck in your test on the 24th. Make sure you complete a full practice test at home under exam conditions to get used to the pressure and timing. Fingers crossed for that 7. All the best, Liz
hope u get better soon and your practice tests and videos have been very useful to me i am planning to write exam in the next few weeks. Hope you get better and make more videos in the upcoming years. thank you for making the practicing the exam much easier and available for everyone. get well soon.
Thanks for your support. Good luck in your coming test 🙂
Dear Liz, here are just some words of love and support for you! Take care and feel better. Thanks a lot for everything you’re doing. You’re great!
Thank you so much for your kind message. That’s really kind of you and much appreciated. As soon as my health is more stable, I’ll make a personal update video to explain what happened to me and how I am.
Hi Liz In your video clip you mention a previous lesson were you showed how to make a sentence like this, where can I find that lesson? Thanks
Sorry I took it down to remake it and then became too sick. Hopefully next year I might be able to do it again.
I pray you will get well soon (Hope you are well at the moment). Thanks for all you do. I really do appreciate all your efforts.
I want to know if you have writing correction services and how much it cost.
Thank you in anticipation of a quick response.
Sorry I don’t offer a marking service. Thanks for your best wishes for my health.
Dear Liz, I hope you are fully recovered? thank you so much for your helpful tutorial videos. My exam is scheduled for today.
You did an amazing job for all of IELTS students. Thanks a bunch. My exam is on 29th October, keep me in best wishes please.
Lots of luck!
That is very useful to me !
Is it correct to describe a pie chart in terms the sections it is divided to and also to list what the key categories are in the overview? thank you
https://ieltsliz.com/ielts-writing-task-1-lessons-and-tips/
I am studying for my IELTS exam and your videos have been so useful for me. Thank you so much fo you Help Liz.
Thanks for your fabulous effort
We can start any graph by writing. .. To begin with or To commenc with or as it can observe Mam which one is right for task
See my model answers: https://ieltsliz.com/ielts-writing-task-1-lessons-and-tips/
Thank you so much mam .
Thank you for your sincere lessons. I learned a lot of English from you via those videos. I think the link that established for the “Task 1 Main sentences” (the one you mentioned in the “”complex sentences for line graph”) is no longer there. However, I have got lots of point from you from the other video.
Dear liz. I have learnt a lot from this site and enormous thanx from my side.
You’re welcome 🙂
Liz, you style is great and material is very useful. thanks
very useful, thank you.
Thank you Liz, I’m from Kazakhstan and I’m still watching your useful videos, keep making the new videos for us😊
You life free things right?
Thank you very much for your dedication to helping students preparing to take the ielts exam.
The video you recommended for students to watch at the beginning of this video lesson is not available. Could you please check on that for us? Thank you.
This video is awfully useful because the content was well organized. Further, it was discussed thoroughly. Liz reminds of my teacher in highschool, quite an amazing and charming person, whose love for teaching is incomparable. YOUR FAN FROM THE PHILIPPINES -Xander-
Thanks you so much, Xander!! That is a great compliment 🙂
Hi you are just perfect. Your knowledge, style of teaching, clarity is amazing. I wish some of the school teachers in my country watches your program and adapt this way of teaching in their method. Many many thanks
That’s so kind. I’m really pleased my teaching method is easy to follow and is helping you learn 🙂
Hi Ma’am! You r really an inspiration.I am an indian student and doing ielts now and the material u provide really really help me alot.I hope it will bring me good results.
Thankyou so much 🙂
Hi Ma’am! You r really an inspiration.I am an indian student and doing ielts now and the material u provide really really help me alot.
Hi Liz I’m a new student for you. You are terrific
I hope you find the help you need in my website. All the main pages for IELTS are found by clicking the part you want in the red bar at the top of my site. And you can find more options in the right hand side column. Good luck!
You are a great teacher and polished presenter who is so creative in lesson design and delivery. The world is in need of such dedicated and passion – driven people like you. Keep up the good work, you have helped a lot of people to realize their goals.
Hi teacher How we can add extra information in process essay and write more words?
See the model diagram answer and tips on this page: https://ieltsliz.com/ielts-writing-task-1-lessons-and-tips/ . Don’t forget that task 1 is not an essay, it is a report.
Hi Liz I can’t write an overview and details what should i do?
Practice. See the main writing task 1 page.
It was awesome and you are a great teacher
thank you so much
Hi Liz, thank you so much for your helping. I want to know that the video ( Writing Task 1 Lesson : How to make a complex sentence) is not available because it said a private video . we hope to change this as soon as possible . Thanks a lot Liz Rabab
Why is my question of 5 August still ‘awaiting moderation’?
Because I have over 1000 comments in waiting. I work alone for free and don’t have time to help everyone.
Hi Liz, I am really enjoyed following your video lessons ,its really helpful,well presented and clear to understand.Just I need to focus more , practice and follow your tips in order to improve my English 4 skills . Thanks a lot note: On the Top of Video there was missing latter (R) It is written ( 4 main Complex sentences stuction ) and it should be stRucture .
Thanks. I’ve got so many types. Unfortunately I can’t change the video once it has been posted. Shame.
I just want to say thank you liz your videos are great.
hi Liz, First of all i wanna thankyou for your great lessions,tips and information that you have been providing to many students at free of cost.Also you are great teacher who really care the needs and problems of your followers and students.Actually i wanna ask some question 2 you as i am confused about where to you this four complex structures.should we use only on overview or we can use it on both overview and bodyparagraph.
These complex sentences contain numbers and dates. That means they contain detail and all details should go in the body paragraphs. See this page: https://ieltsliz.com/writing-task-1-paragraphs/
I can’t watch the lesson 1 seems like private.
This video has been removed and will be remade in the future.
I read the transcript and it was understandable. Thanks Liz
Liz , it’s awesome ,quite beautiful material on your website really I’m gratitude you for the worth effort that you made . I have a question regards fearing of fail (low band score < 6) in term of submitting my request for IELTS test. I think I have enough background of words ,grammars but while I need to use it with the native people around me I'm feeling it lost ,
Learn more about writing task 1 band scores: https://ieltsliz.com/ielts-writing-task-1-band-scores/
Liz, I’m a great fan of you and your blog! Keep it up. I have learned many things from you. Thank you very much.
You are doing a great job with you blog, by the way the video that you mention here that we need to watch is not available, it says private. Why is that? Thank you for your reply.
Sorry I am planning to remake that video but not for a while.
If i write twenty people instead of ’20 people’ provided that it fulfills the criteria, is that going to be wrong?
Congratulations! Your blog is fantastic and so helpful !! Please go on with it! Kind regards from Spain!!
I’m glad it is useful 🙂 If you need further help for writing task 2, see my advanced lessons: http://subscriptions.viddler.com/IELTSLizStore . All the best Liz
Liz, Hope you are doing well.I think your teaching is more helpful for every ielts student.Anyone can be progressed from it…….U should upload more video in this connection Best wishes Hafiz
Hello Liz, First of all , I would like to tell you that it is not sufficient to use all of the water in the universe as ink to express my admiration of your extremely helpful videos. I just have one more request which I hope you do not reject. Would you please post a video or even written material describing how to deal with flow charts?I have searched the internet but I have found nothing about that. A one more request is that , I want to re-write one of the writing tasks (actually Task 1 ) you have posted but in my own words and I would like you to check it with me to assess my band score before attacking the IELTS test. Thanks a lot in advance for your guidance and support.
https://ieltsliz.com/liz-notice-2015-2016/
Hello! Liz, I am from Bangladesh. I would like to Thank you for your helpful videos,tips and suggestions. I am preparing for my IELTS by following your blogs and materials but I don’t know why I am unable to watch your one videos which called how to write complex sentences of line graph.Eagerly waiting for your reply and help.
Hello liz what about the sentence…….. A steady increase has been seen in the number of people becoming vegetarian from about 75 to 200 between 2004 and 2007.
Liz you have made everything clear like crystal. I am going to appear for IELTS after 8 days, I hope I will follow every tips you gave
Wow,It is awsome!….Thank you very much Liz 🙂
You are the Best
hi liz can u pls check my work
The line graph illustrates four different ways of good transportation (road, water, rail and pipeline) in U.K. The data was collected between 1974 and 2002. Units are measured in million tons.
Overall, there is an increased in the demand in transferring of goods by means of road, water and pipeline. On the other hand, utilization of rail was fluctuating throughout the period but remain identical at end of the span.
Road being the primary means of transportation started over 70 million tons in 1974 and increased to almost 100 million tons at the end of the period. However, same way with pipeline which is the least popular, came at around 5 million tons in the beginning but deflated over four folds in 1994 and remain constant until 2002.
Moreover, water and rail started at almost the same level with around 40 million tons, but not until in 1992 where in water started to gradually increased until around 65 million tons, in contrast to rail that begins to fluctuate between 20 to 40 million tons and ended up over 40 million tons.
https://ieltsliz.com/posting-writing/
Liz, thank you for your valuable lessons & tips. I have one query about the rephrasing the statement in a complex way. For example, in the above video you suggested to use the verb ‘experience’ which is not mentioned in the question, then how could it be relevant for this topic & how can we decide whether which one would be suitable. The number of people becoming vegetarian ‘experienced’ (???) How can we say that they experienced / witnessed. Could you please guide me on this? I request for an early reply, as I have my IELTS exam tomorrow.thank you.
This relates to the word “number” not the word “people”. The number [of smth] experienced an increase…” All the best Liz
Hi Lyz, great site! It’s helping me a lot. I have a doubt about the following sentence I wrote while practicing task 1 on a line graph. Here it goes: “Overall, Leatherback turtles showed a decrease in their population through the years, while the Olive Ridley turtles displayed an increase.” I think there’s something wrong with the subect… thanks!!!
It’s better to write: “Overall, there was a decrease in the population of Leatherback turtles, while the population of Olive Ridley turtles witnessed an increase”. You need to understand that it is not the Leatherback turtles that are decreasing, it is the population of Leatherback turtles. It is a common mistake that many students make when writing the subject. All the best Liz
Liz, u are really a great teacher, may ALLAH blessing u.,,, I want to give u my favourite teacher award, do u have any Facebook account? 🙂 Or what’s your personal email address?? Tell me please 🙂
It is my pleasure to help IELTS students. You can contact me any time on this blog or follow my facebook page which is in the right hand side column. All the best Liz
hi liz , i couldn’t see the video , what should i do
This video has been removed for the present time. All the best Liz
Once again Hi Liz,
Fortunately I found the transcript of this video and I’ve got the complex sentences and pretty clear with the topic. 🙂 and I’m writing down the 4 different sentences.
1. The number of people becoming vegetarian increased steadily from about 75 to 200 between 2004 and 2007. 2. There was a steady increase in the number of people becoming vegetarian from about 75 to 200 between 2004 and 2007. 3. Between 2004 and 2007, the number of people becoming vegetarian increased steadily from about 75 to 200. 4. The number of people becoming vegetarian experienced/witnessed a steady increase from about 75 to 200 between 2004 and 2007.
PS: Possibilities of errors. Thanks Liz.
All perfect 🙂
Sorry what the meaning of experienced here. I know that it means suffer from pain or any harmful emotions
I am not able to view your videos. It says the video is private. What should I do?
Sorry I removed this one in order to remake it. Liz
THANK YOU!!!
Hello there Liz, I browsed another site for IELTS test and according to the lecturer, I should use the “uhm”words for Speaking just to make it natural conversation with the examiner? But according to your lecture video, it is sign of hesitation? Pls enlighten me. Big thanks.
I’m having trouble analyzing graph, chart and pie in writing part one. What is the best way for me to easily understand them? Pls help. Many thanks
See practice lessons and model answers on this page: https://ieltsliz.com/ielts-writing-task-1-lessons-and-tips/ Liz
The sound “uhm” is used when you are thinking of what to say. It is a sound for hesitation. All hesitations will lower score you. If you need time to think, then use the phrase “well, let me see”. Use language not sounds. Liz
is trhere any sample for flow chart?what can i use instead of if for conditional sentences? thanks in advance.
Flow charts are the same as diagrams. Please see the lesson on the main writing task 1 page. Liz
Very very useful skills. I’ve been struggling with this problem for long and now it’s super clear. Very smart lesson. THX Liz!
Glad it was useful 🙂
Hello Liz, pls I would like to ask whether I can use the past tense of these vocabularies. e,g instead of using go up, can went up be used? thank you.
You use past tense when the graph is presenting dates in the past. “go up” = “went up”, increase = “increased” etc All the best Liz
Hi Liz! First of all I would like to thank you for your revealing videos! I would like to ask you some information about the position of time and place adverbs in english sentences. It is not clear to me wether the adverb of place should come first or not. For example, “The number of people becoming vegetarian increased steadily …between 2004 and 2007 in China” or “The number of people becoming vegetarian increased steadily … in China between 2004 and 2007”? Is there a standar grammatical rule? Thank you!
See this page: http://www.englisch-hilfen.de/en/grammar/satzstellung_2.htm Liz
I want to get 6.5 in writing. so what should I do now. plz write me.
Follow all information pages, tips and lessons. Make sure you read all band score pages. Alternatively you can take a look at my video lessons from my online course for writing task 2: http://subscriptions.viddler.com/IELTSLizStore All the best Liz
Hi Liz ! It’s a very great job you doing, thank you very much! I am sure you enjoying it yourself too 🙂
Liz, it is absolutely an amazing lesson. thank you.
I’m so happy you liked the lesson. Sounds like a great festival 🙂 Liz
Hello Liz, I am little bit confuse in this particular lecture. As you said we must use adverb before the noun but my confusion is – Is “increase” is noun or its better if we write steady increment…instead of writing steady increase ? Please Liz help me on this, I have my exam on 1st of August and I am totally getting nervous. Do you have any capsule for IELTS so that I can use it for better score? especially for writing and reading section? Thank you !
“increase” can be used as a noun or verb. You shouldn’t use “increment” as it is not appropriate and rarely used. Paraphrases for increase are rise, climb, grow, go up. Liz
Thank you liz
Hello, I am very interested in different ways of saying the same thing. I realised you use the verb “experience” and would like to know some synonyms. I was thinking about “experiment” and “suffer”. I also saw “undergo” and “be exposed to” on Internet but I am not sure if those can be used for the sample you gave in the video tutorial. Thank you very much.
You can write “the number experienced an increase”, “the number witnessed an increase”, “the number increased” or “there was an increase in the number”. Anything else will be risky and less appropriate. The more errors you make, the lower your score will be. Liz
Thanks a lot Liz 🙂
Speak Your Mind Cancel reply
Notify me of new posts by email.
Advanced IELTS Lessons & E-books

Recent Lessons
50% discount advanced ielts lessons & e-books final day, answers to age group bar chart lesson, ielts bar chart of age groups 2024, 50% discount: advanced ielts lessons & e-books, ielts topic: urban planning, ielts listening transcripts: when and how to use them.

Click Below to Learn:
- IELTS Test Information
Copyright Notice
Copyright © Elizabeth Ferguson, 2014 – 2024
All rights reserved.
Privacy Policy & Disclaimer
- Click here: Privacy Policy
- Click here: Disclaimer
Return to top of page
Copyright © 2024 · Prose on Genesis Framework · WordPress · Log in
IELTS Writing Task 1: top vocabulary practice for dynamic, line graph/ column graph with example sentences and bonus tips
This IELTSdeal post focuses on the use of vocabularies for line graphs or column graphs in IELTS Writing Task 1 . Studying this post you will be able to understand how to write different vocabularies in the same picture description. Look closely at the top example sentences and try to write them regularly for your best preparation for IELTS Writing exam . Some short and simple bonus tips are also given here for your help.

Pictures with a timeline (Dynamic, Line graph/ Column graph):
As you know that you are given a timeline in a line or column graph (even in a double/triple pie chart or table). These are also known as dynamic graphs and you must learn the following sets of vocabulary to achieve a higher score in IELTS Writing Task 1. Writing the same words over and over again will surely affect your writing negatively. So, you should learn to use them in the present, past and future tenses. Also, you need to learn the use of nouns, adjectives, and adverb forms.
First, look at the following graph where you can learn about different trends:

Upward trend:
Common synonyms are given below
Increase, develop, improve, go up, climb, jump, boost, boom, swell, advance, etc.
Here are some examples:
The town saw an increase in population.
The number jumped from 500 to 2000 in 1965.
The government spent 10000 dollars in 2004 for the development of the town. Then, it started to boost further.
Downward trend:
Decrease, decline, dwindle, shrink, go down, lessen, fall down, diminish, etc.
Here are some example sentences:
The rate went down by 25% this year.
The number of admitted students fell.
The number of export declines each year.
The interest in reading books will diminish in the coming years.
Stable trend:
Remained stable, remains steady, no change, stayed equal as before, etc.
Here are some common examples:
From 2000 to 2005 there was no change in the number of workers.
The rate of export remained stable from January 2011 to June 2011.
Fluctuating trend:
Fluctuate, oscillate, vacillate, swing, go ups and downs, wax and wane, etc.
Look at the following examples:
The percentage of illiterate people fluctuated.
The rate oscillates from July to October every year.
A short swing was detected during the last part of the year.
Use of adjectives and adverbs:
To explain the trends, you also need to learn some important adjectives and adverbs which are discussed below.
Have a look at this small list of the table below.
Here are some example sentences which you can practice for a better understanding:
Adjective: There was a slow increase in the number of workers in the factory from 50 to 55 during this time.
Adverb: The number of workers in the factory grew slowly from 50 to 55 during this time.
Adjective: The Company experienced a swift development in the percentage of export from 23% to 67% between 2006 and 2008.
Adverb: From 2006 to 2008 the percentage of export went up swiftly from 23% to 67%.
Adjective: The students had a sequential decrease in their scores.
Adverb: The scores of the students decreased sequentially .
You can try and learn the use of different vocabularies by following these above-given methods.
Bonus tips for practicing vocabularies:
- Practice writing at least 15/20 individual sentences from different graphs, charts, diagrams, and so on.
- Maintain a separate notebook for your vocabulary practice.
- Try to learn the use of nouns, verbs, adjectives, and adverbs, and try to learn the basic differences among them.
- Show your notebook to an expert in the English Language; have your writings checked regularly.
Leave a Reply Cancel reply
Your email address will not be published. Required fields are marked *

A Comprehensive Guide to Increasing Your Vocabulary and Boosting Your IELTS Score
The International English Language Testing System (IELTS) is a widely recognized English language proficiency test that assesses your skills in listening, reading, writing, and speaking. A strong vocabulary is crucial for success in the IELTS exam as it plays a significant role in all four sections. In this comprehensive guide, I will provide you with […]

Mastering the IELTS: A Comprehensive Vocabulary Guide with 80 Essential Words; with examples
Achieving success in the International English Language Testing System (IELTS) demands more than just grammar and language fluency. A robust vocabulary is a cornerstone of effective communication and essential for obtaining a high band score. In this comprehensive blog post, we present an extensive list of 80 hand-picked IELTS vocabulary words, complete with their word […]
IMAGES
VIDEO
COMMENTS
If the line graph contains many lines and a lot of movement, be selective. You are being marked on your ability to select key features. Don't spend more than 20 mins on task 1. You will need a full 40 mins for task 2. Write 150 words or more. Aim for about 160-190 words. Don't write under the word count.
In a nutshell: Writing Task 1 Line Graph Tips. IELTS writing task 1 line graph tips help you to get high scores in the test of IELTS writing. Apply these tips during your preparation and while attempting test. I assure you that it will be easy for you to get good bands. Frequently asked questions (FAQs) about IELTS writing line graph
Tips for IELTS Writing Task 1 Line Graph 2022. In the introduction part, you can paraphrase the question asked or the topic of the essay. When you explain the overall trend, identify the main feature and explain it. Ensure that each paragraph has examples that are percentages or numbers to support the sentence written as an explanation.
This section presents a list of common IELTS Academic Writing Task 1 - Line Chart questions. If you want to prepare for the IELTS Writing Test, these questions are a must study. Question 1. The chart illustrates consumption of three kinds of fast food by teenagers in Mauritius from 1985 to 2015. Summarise the information by selecting and ...
Step 2: Group data, identify common trends and exceptions and choose the main features. Step 3: Writing essay (using paraphrased words and data collected from step 1 and 2 to finish) Now let's begin with the first type of graph: "the line graph". Look carefully at the line graph below: So, following step 1: read the topic carefully and ...
Steps to effectively write an IELTS Writing Task 1 Line Graph essay. 3.1. Step 1: Analyse the Line Graph IELTS Task 1 question. In the question given, there will have: A short description of the Line graph (e.g. The graph below shows radio and television audiences throughout the day in 1992.)
Line graphs are a very common IELTS writing task 1 question type. You will be given a line graph (or sometimes two) with multiple lines that illustrate a change over time. The line graph (s) will have two axes; the X-axis (horizontal) will typically show the time period and the Y-axis (vertical) will show the measurement.
The structure for IELTS writing task 1 line graph is simple as the introduction, overview, body paragraph 1 and body paragraph 2. In the body paragraphs, you have to add main features of the line graph. There are five steps to answer in IELTS line graph: First of all, understand the line graph.
This is a very common question type for IELTS Academic Writing Task 1. On this page, you will find a complete discussion on IELTS Task 1 Line Graph question. The discussion will proceed under the following 7 major steps: Analyse the question. Identify the major features. Remember the 4 paragraph structure.
Tips for line graph. Candidates should follow the tips mentioned below to score high in the writing task 1 line graph: Pay attention to the title of the graph and use it to give an overview. Follow it up with the parameters as mentioned in the X and Y-axis. Describe the line pattern using visual words such as steady increase, or sharp decline.
Guide to Task 1 Line Graph. Writing task 1 of the IELTS requires you to jot down an outline of a minimum of a hundred and fifty words in answer to a particular graph (bar, line or pie graph), table, chart, or method (how one thing works, however one thing is done). This task exercises your proficiency to pick out and note the most choices, to ...
Introduce the Graph. You need to begin with one or two sentences that state what the IELTS writing task 1 shows. To do this, paraphrase the title of the graph, making sure you put in a time frame if there is one. Here is an example for the above line graph: The line graph compares the fast food consumption of teenagers in Australia between 1975 ...
Start at the beginning, with the first year on the left of the x axis. Compare the numbers (i.e. all lines) in that year. Then choose an interesting point towards the middle of the graph, and compare the figures at that point. OR: Summarise the line trends over the first half of the period (to somewhere around the middle of the graph).
The IELTS Writing Task 1 often features a line graph. Describing a line graph is not as difficult as it seems. In fact, there are a few things to remember to help you gain a band 7.0 score. Grammar You can learn these two structures and, with only a little bit of variation, you can […]
These are line charts and graphs that I've collected over the years from real past IELTS exams and other practice materials. If you want to stay up to date with all the latest task 1 questions, you can find those here. Here are the IELTS line charts and graphs! Also find my EBooks here. Dave. IELTS Task 1: Line Charts and Graphs Read my essay ...
Tips for Line graph Line graphs always show changes over time. Here's some advice about how to describe them: · Try to write 4 paragraphs - introduction, summary of main points, 2 detail paragraphs. · For your summary paragraph, look at the "big picture" - what changes happened to all of the lines from the beginning to the end of the period shown (i.e. from the first year to the last).
Writing Tips for a Graph in the Future in IELTS Academic. Graph in the future: Sometimes graphs in IELTS refer to a future time. You must know the language to write about these. In this lesson, learn how to write about an IELTS graph in the future. Getting the tenses right is an important part of the IELTS writing task 1.
The most useful phrases for the body of IELTS Writing Task 1 line graph task essays. Starting body paragraphs. Describing trends/ changes over time. Comparing and contrasting (the lines and parts of lines) Describing times. This is a short list of vital words and phrases to memorise in order to do well in IELTS Academic Writing Part 1 line ...
IELTS Writing Task 1 (academic): This lesson contains eight useful tips about how to describe line graphs.
a line graph report in IELTS writing task 1. it's very important when you write. your body paragraphs for your. IELTS task 1 that you have a range. of different complex sentences to show the examiner. now in a previous lesson. I showed you how to write a sentence. similar to this if you haven't watched that. lesson please watch it is very ...
Pictures with a timeline (Dynamic, Line graph/ Column graph): As you know that you are given a timeline in a line or column graph (even in a double/triple pie chart or table). These are also known as dynamic graphs and you must learn the following sets of vocabulary to achieve a higher score in IELTS Writing Task 1.